
FIGURE
Fig. S5
Fig. S5
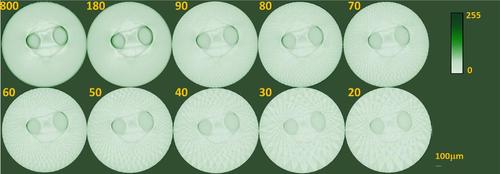
TraNac Tg(KDR:mCherry) zebrafish embryo 2D transaxial slices reconstructed from the densely sampled (800 projections) and down-sampled transmission data sets using the conventional FBP method. The number of projections used to reconstruct the images is indicated in each subfigure (left). Reconstructed slices are presented in a 0–255 contrast scale as indicated by the color bars. Scale bar pertains to all images. |
Expression Data
Expression Detail
Antibody Labeling
Phenotype Data
Phenotype Detail
Acknowledgments
This image is the copyrighted work of the attributed author or publisher, and
ZFIN has permission only to display this image to its users.
Additional permissions should be obtained from the applicable author or publisher of the image.
Full text @ PLoS One