
- Title
-
Dynamics of the slowing segmentation clock reveal alternating two-segment periodicity
- Authors
- Shih, N.P., François, P., Delaune, E.A., Amacher, S.L.
- Source
- Full text @ Development

Clock expression in anterior PSM cells gradually slows and increases in amplitude over the last two oscillations. (A) Representative embryo indicating somite designations in PSM and developing somites, with regions delineating formed somites (S1, S2), forming somite S0 and future somites (S-1, S-2) indicated. Gray and orange lines denote the approximate positions of cells at the last timepoint in B and C, respectively. Labeling of the nucleus and cell membrane is indicated by H2B-Cerulean (blue) and lyn-mCherry (red), respectively (A), and Her1-Venus reporter fluorescence is shown in green (A′). (B,C) Single-cell clock oscillations in a group of five neighbors in the posterior PSM (B) and the anterior PSM (C). Number of clock oscillations remaining is included in quotes above the expression peaks, with ‘P0’ indicating the last oscillation peak, ‘P-1’ indicating the second-to-last oscillation peak, and so on. The ‘P0’ oscillation peak occurs within S-1 or S0, depending on their final position in the forming somite (Delaune et al., 2012). Gray dashed lines indicate the times at which morphological somite boundaries are visibly formed. (D) The periodicity of clock expression relative to the periodicity of somitogenesis. Periodicity of oscillations was measured in four embryos (n=243 cells) based on the time between peaks of maximum expression. Somite periodicity was calculated based on the timing of morphological alignment of the boundary cells. (E) The change in clock expression amplitude measured in four embryos (n=243 cells), based on the ratio of amplitude change between two sequential oscillations. Data are mean±s.e.m. |

Neighboring anterior PSM cells oscillate synchronously regardless of final somite position, while cells at a one-somite distance are in anti-phase. (A) Embryo at one timepoint (220min, in B-E) during a time lapse. Her1-Venus reporter fluorescence is indicated in green, with nuclei and membrane labeled with H2B-Cerulean and lyn-mCherry, respectively. (A2) Black and white image of the embryo in A. Colored outlines indicate the cohort of cells used to represent each boundary. S0 and S1 boundary cohorts (red/blue and orange/green, respectively) were identified by retrospectively tracing actual boundary cells. (B-E) Raw reporter fluorescence levels of three representative cells from each boundary cohort indicated in A′. To indicate the periodicity of somite formation, gray dashed lines indicate times at which morphological somite boundaries are forming in the imaged embryo. (F-I) Histograms of phase differences between boundary cell cohorts. Comparisons are made at every timepoint in the timelapse, and cells were identified based on their position at the end of the timelapse. Comparisons were made only if both cells were still oscillating. Phase differences are plotted between 0 (indicating cells are exactly in phase) and π (indicating opposite phase). Distance between the two compared populations increases from left to right. Average phase differences are 0.75 (F), 1.12 (G), 1.59 (H) and 2.17 (I), calculated from 15,003-35,740 pairwise comparisons in four embryos. See also supplementary material Figs S1-S3. |
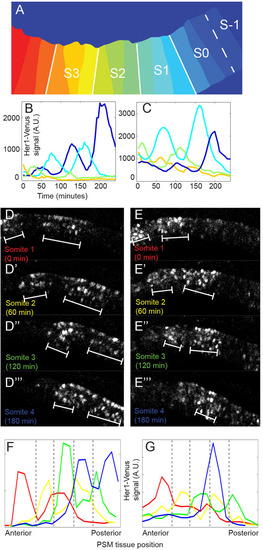
In the anterior PSM, clock oscillations have a two-somite periodicity. (A) An example of PSM tissue separated into sectors for tissue-level fluorescence measurements that depicts a representative endpoint for traces shown in B and C. Tissue fluorescence was measured using the center one-third of each future somite to ensure fluorescence measurements were representative of only one somite. White lines denote the position of somite boundaries at the end of the timelapse. (B,C) Tissue-wide fluorescence quantification in two representative embryos. Total fluorescence in the center slice of each future somite and S0 is plotted through time until the somite forms. Line color matches stripe position in A. Tissue-level fluorescence amplitude quantification is noisier for cell groups oscillating near the baseline, and trends observed when following single cells (e.g. last peak having highest amplitude) are not always recapitulated when tissue-level peaks and troughs are close to the baseline (e.g. green traces). (D,E) Raw fluorescence confocal image of Her1-Venus signal (a merge of five consecutive z-stacks) in two different embryos. Images shown are PSM ‘snapshots’ taken just as a somite is forming more anteriorly, based on morphological landmarks. White brackets denote areas of highest clock reporter expression. (F,G) Clock reporter levels were quantified across the PSM at each timepoint shown in D-D′′′ and E-E′′′, respectively, and then mapped collectively onto a reference PSM. Line color corresponds to labeling in D-D′′′ and E-E′′′. Gray dotted lines mark morphological somite boundaries (which appear later). See also supplementary material Fig. S4. |
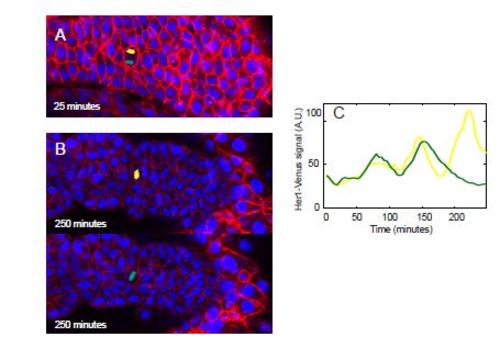
Related to Figure 2: Oscillations in daughter cells after mitosis that eventually contribute to opposing sides of a somite boundary. (A) A dividing cell within the PSM, during anaphase. Each separate nucleus is pseudo-colored. (n=1) (B) The final positions of the daughter cells, with the yellow pseudo-colored cell located in S0 (top) and the green pseudo-colored cell located in S1 (bottom). (C) Oscillation dynamics of the individual daughter cells over time. |
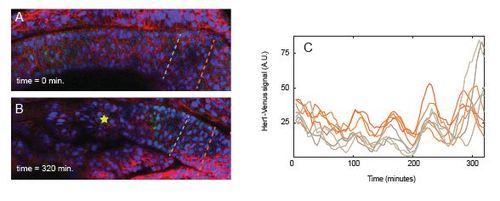
Related to Figure 2: Cells in the posterior PSM oscillate in-phase with each other. A representative embryo at the beginning (A) and end (B) of a timelapse experiment. Anterior to the left. Orange and gray dotted lines indicate position of cells that were sampled for oscillations. At t=0, the cells lie roughly at S-4 and S-5, respectively, and at the end of the movie, they are at approximately S-1 and S-2. Yellow star in (B) indicates the newest formed somite at that timepoint. (C) Oscillations of five representative cells from each region are shown. Oscillations in these two populations of orange and gray cells become asynchronous by the last oscillation of the timelapse (t=300 minutes). |