
|
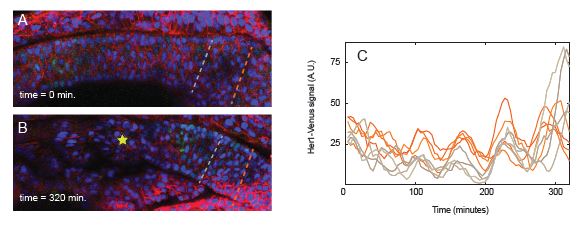
Fig. S3 Related to Figure 2: Cells in the posterior PSM oscillate in-phase with each other. A representative embryo at the beginning (A) and end (B) of a timelapse experiment. Anterior to the left. Orange and gray dotted lines indicate position of cells that were sampled for oscillations. At t=0, the cells lie roughly at S-4 and S-5, respectively, and at the end of the movie, they are at approximately S-1 and S-2. Yellow star in (B) indicates the newest formed somite at that timepoint. (C) Oscillations of five representative cells from each region are shown. Oscillations in these two populations of orange and gray cells become asynchronous by the last oscillation of the timelapse (t=300 minutes).