
Fig. 3
- ID
- ZDB-FIG-150804-10
- Publication
- Shih et al., 2015 - Dynamics of the slowing segmentation clock reveal alternating two-segment periodicity
- Other Figures
- All Figure Page
- Back to All Figure Page
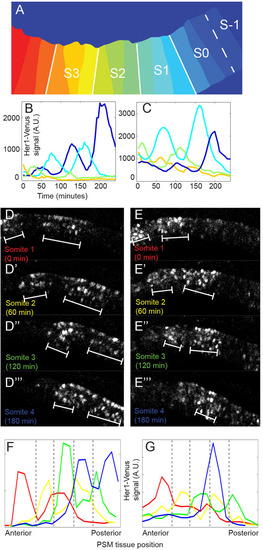
In the anterior PSM, clock oscillations have a two-somite periodicity. (A) An example of PSM tissue separated into sectors for tissue-level fluorescence measurements that depicts a representative endpoint for traces shown in B and C. Tissue fluorescence was measured using the center one-third of each future somite to ensure fluorescence measurements were representative of only one somite. White lines denote the position of somite boundaries at the end of the timelapse. (B,C) Tissue-wide fluorescence quantification in two representative embryos. Total fluorescence in the center slice of each future somite and S0 is plotted through time until the somite forms. Line color matches stripe position in A. Tissue-level fluorescence amplitude quantification is noisier for cell groups oscillating near the baseline, and trends observed when following single cells (e.g. last peak having highest amplitude) are not always recapitulated when tissue-level peaks and troughs are close to the baseline (e.g. green traces). (D,E) Raw fluorescence confocal image of Her1-Venus signal (a merge of five consecutive z-stacks) in two different embryos. Images shown are PSM ‘snapshots’ taken just as a somite is forming more anteriorly, based on morphological landmarks. White brackets denote areas of highest clock reporter expression. (F,G) Clock reporter levels were quantified across the PSM at each timepoint shown in D-D′′′ and E-E′′′, respectively, and then mapped collectively onto a reference PSM. Line color corresponds to labeling in D-D′′′ and E-E′′′. Gray dotted lines mark morphological somite boundaries (which appear later). See also supplementary material Fig. S4. |