
- Title
-
Biochemical Characterization of Three BLT Receptors in Zebrafish
- Authors
- Okuno, T., Ishitani, T., Yokomizo, T.
- Source
- Full text @ PLoS One
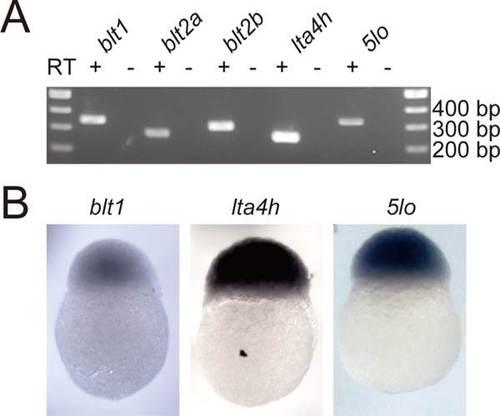
Expression of blt1, blt2a, blt2b, lta4h, and 5lo in zebrafish embryos. (A) Expression of blt1, blt2a, blt2b, lta4h, and 5lo mRNA were analyzed by RT-PCR. Total RNA was obtained from 24 hpf embryos and analyzed using specific primers for blt1, blt2a, blt2b, lta4h, and z5lo. (B) Expression of blt1, lta4h, and 5lo mRNA was analyzed by whole-mount in situ hybridization. Zebrafish embryos (3 hpf) were hybridized with antisense probes. |

Morpholino-mediated knockdown of blt1 and lta4h affects epiboly. (A) Diagram of a partial map of blt1 genomic DNA. Exons and introns are shown as boxes and lines, respectively. Two nonoverlapping blt1 MOs, blt1 MO and blt1 spl MO, were designed to target translation and splicing of Blt1, respectively. The blt1 MO should eliminate the transcription of exon 1, which contains the translation start site, resulting in aberrant protein synthesis. The efficacy of blt1 spl MO was validated by RT-PCR using blt1_fw and blt1_rv or blt1_rv2. Total RNA was isolated from blt1 spl MO or control MO-injected embryos at 24 hpf. Reduced expression of normal spliced blt1 transcripts and increased mis-spliced blt1 transcripts are shown. (B) Representative images of delayed epiboly of blt1 and lta4h morphants from 4 to 10 hpf. Embryos were injected with 2.5 ng MOs at the 1- to 2-cell stage. (C) Histogram illustrating the percentages of normal and delayed embryos. **, P < 0.005, one-way ANOVA with Bonferroni post-hoc test. Data are representative of at least two independent experiments with similar results. |
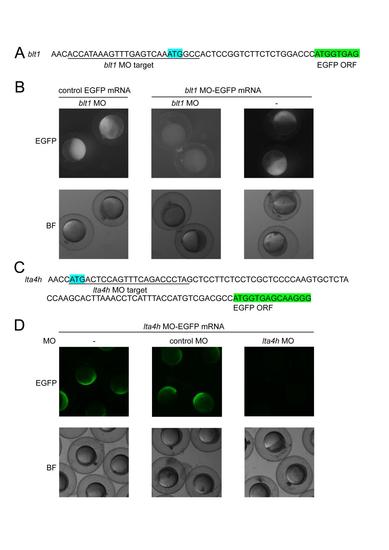
Specificity of blt1 and lta4h morpholinos. (A) 5′ sequence of EGFP mRNA designed to evaluate the function of the blt1 MO. The underline indicates the blt1 MO target sequence, the start codon is highlighted in blue, and the beginning of the open reading frame (ORF) of EGFP is highlighted in green. (B) Representative images of the effects of the blt1 MO on the expression of control EGFP and blt1 MO-EGFP. Translation of EGFP mRNA containing the blt1 MO target sequence is blocked by the blt1 MO. Control EGFP is not blocked by the blt1 MO. Embryos were injected with a mix of mRNA (250 pg) and MO (2.5 ng) at the one cell stage. EGFP fluorescence and bright-field (BF) images were taken at 7 hpf. (C) 5′ sequence of EGFP mRNA designed to evaluate the function of the lta4h MO. The underline indicates the lta4h MO target sequence, the start codon is highlighted in blue, and the beginning of the ORF of EGFP is highlighted in green. (D) Representative images of the effects of the lta4h MO on the expression of the lta4h MO-EGFP. Translation of EGFP mRNA containing the lta4h MO target sequence is blocked by the lta4h MO but not by a control MO. Embryos were injected with a mix of mRNA (250 pg) and MO (2.5 ng) at the one cell stage. EGFP fluorescence and BF images were taken at 6.5 hpf. |