
- Title
-
Spatial and temporal control of transgene expression in zebrafish
- Authors
- Akerberg, A.A., Stewart, S., Stankunas, K.
- Source
- Full text @ PLoS One
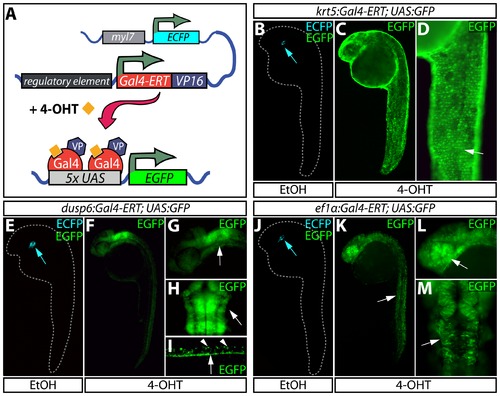
Temporally and spatially controlled transgene expression in zebrafish. (A) Schematic of transgenic constructs used in the Gal4-ERT system. A tamoxifen-responsive Gal4-ERT-VP16 construct is expressed from a tissue-specific promoter that activates any UAS-linked responder line (shown here as a 5xUAS:EGFP reporter) upon tamoxifen or 4-OHT exposure (orange squares). The myl7:ECFP cassette serves as a transgenesis marker for the Gal4-ERT lines. (B–D) Visualization of EGFP expression in Tg(krt5:Gal4-ERT-VP16; UAS:EGFP) animals treated with ethanol (B) or 2 μM 4-OHT (C and D) from 4–24 hpf. The white arrow in panel D highlights expression of EGFP in the epidermis. (E–I) EGFP expression in Tg(dusp6:Gal4-ERT-VP16; UAS:EGFP) animals treated with vehicle (E) or 2 μM 4-OHT (F-I) from 4–24 hpf. In panels G and H, the white arrow indicates EGFP expression in the hindbrain and midbrain-hindbrain boundary. In panel I, arrowheads mark dorsal spinal cord neurons and the arrow points to EGFP expression in the floor plate. (J–M) Expression of EGFP in control (J) and 4-OHT treated (2 μM, K-M) Tg(ef1α:Gal4-ERT-VP16; UAS:EGFP) animals in a variety of cell types throughout the embryo including skeletal muscle (K, white arrow), the eye (L, white arrow), and the midbrain/midbrain-hindbrain boundary (M, white arrow). In panels B, E, and J, blue arrows point to myocardial ECFP expression, which represents the marker for transgenesis and serves as an internal control. |
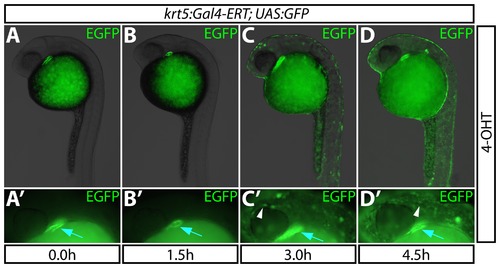
The Gal4-ERT system provides rapid induction of gene expression. (A–D) Kinetics of EGFP expression in Tg(krt5:Gal4-ERT-VP16; UAS:EGFP) animals upon administration of 2 μM 4-OHT at 24 hpf for 0–4.5 hours. (A2–D2) High magnification images demonstrating EGFP expression for each treatment. White arrowheads point to epidermal expression of EGFP; blue arrows indicate bleed-through from the heart muscle-specific ECFP transgenesis marker. |
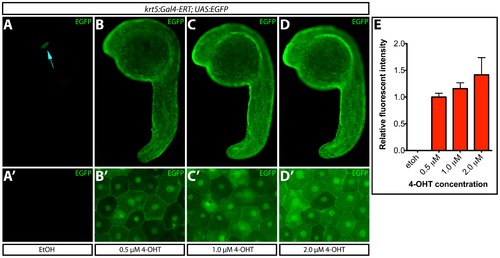
Transgene expression levels depend upon 4-OHT dosage. (A–D) EGFP expression upon treatment of Tg(krt5:Gal4-ERT-VP16; UAS:EGFP) zebrafish with ethanol or the indicated dose of 4-OHT from 4–24 hpf. The blue arrow indicates myl7:ECFP expression. (A2–D2) High-magnification images of ventral epidermis from fish in each treatment group. (E) Normalized EGFP intensity (to the 0.5 μM 4-OHT treated group) of fish treated with ethanol or 4-OHT. Error bars represent standard deviations. |

Inducible transgene expression in adult zebrafish. (A–D) Expression of EGFP in the eye of a single adult Tg(krt5:Gal4-ERT-VP16; UAS:EGFP) zebrafish prior to (A and B) and after (C and D) treatment with 1 μM tamoxifen for one hour per day for three consecutive days. Green arrows point to EGFP expression in the eye. The areas bounded by the dashed red box in A and C are shown at high magnification in B and D, respectively. (E–H) Immunostaining of paraffin sections with anti-EGFP antibodies (shown in green) in eyes from DMSO- (E and F) and tamoxifen-treated (G and H) Tg(krt5:Gal4-ERT-VP16; UAS:EGFP) fish. Panels F and H show overlays with anti-EGFP antibody staining in green, Hoechst-stained nuclei in blue, and auto-fluorescence in red. Fish were drug treated as in A–D. Green arrows indicate EGFP expression in photoreceptors and asterisks (*) denote auto-fluorescence in photoreceptor outer segments. (I) In situ hybridization for EGFP mRNA in a paraffin section from a 4-OHT treated Tg(krt5:Gal4-ERT-VP16; UAS:EGFP) animal. The blue arrow shows EGFP expression in photoreceptors. |

Overexpression of the Notch1 intracellular domain using the dusp6:Gal4-ERT driver disrupts notochord development. (A and B) EGFP expression at the 10-somite stage in control (A) and 2 μM 4-OHT treated Tg(dusp6:Gal4-ERT-VP16; UAS:EGFP) fish. The green arrow points to EGFP expression at the midline. (C–F) DIC images of control (C and D) and 4-OHT treated (4 μM from 2–24 hpf, E and F) Tg(dusp6:Gal4-ERT-VP16; UAS:NICD) animals at 24 hpf. Regions bounded by the dashed red box in panels C and E are shown in high magnification in panels D and F, respectively. In panel D, the red arrow indicates the floor plate (fp) and the blue arrow indicates the notochord (nc); in panel E, the magenta arrow highlights the reduced notochord and disorganized floor plate. |

Using inducible expression to define temporal roles of Notch1 signaling in notochord development. (A–E) Expression of myc-tagged NICD by immunostaining with myc antibodies on 24 hpf Tg(dusp6:Gal4-ERT-VP16; UAS:NICD) embryos treated with ethanol (A) or 4 μM 4-OHT at the indicated times (B–E). Blue arrows indicate myocardial ECFP expression to mark transgenic animals and magenta arrows show expression of myc-tagged NICD. Panel insets display high magnification images of boxed regions where red arrows indicate the notochord (A and E) and the missing notochord (B–D). (F) Normalized penetrance of notochord defects in Tg(dusp6:Gal4-ERT-VP16; UAS:NICD) animals treated with 4-OHT at the indicated stages of development. Each data point represents the normalized fraction of affected animals in sets of treated embryos from four independent clutches. The data is normalized to the average fraction of abnormal fish in the four 4–24 h sets. The double asterisk indicates a significant difference between 4–24 h and 10–24 h 4-OHT treated fish (P<0.005). (G–I) Expression of shha in the floor plate of animals treated with ethanol (G) or with 4-OHT for the indicated times (H–I). Boxed regions are shown at higher magnification in the panel insets. Red arrows indicate shha expressing floor plate cells. |
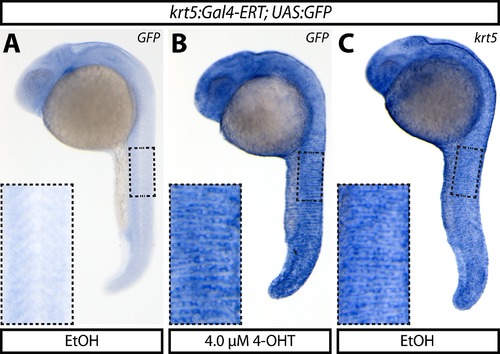
krt5:Gal4-ERT expression matches that of endogenous krt5. (A–C) Whole mount in situ hybridization of GFP expression in ethanol (A) or 4-OHT-exposed (B) 24 hpf Tg(krt5:Gal4-ERT-VP16; UAS:EGFP) embryos compared to endogenous krt5 expression (C). Boxed regions are shown at higher magnification in the panel insets. |
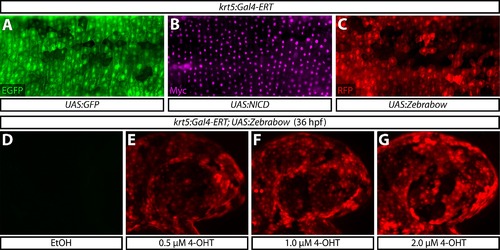
Multiple UAS reporter lines produce robust and dose dependent responses to activated Gal4-ERT. (A–C) The krt5:Gal4-ERT line is compatible with UAS:EGFP (A), UAS:NICD shown by anti-myc immunostaining (B), and UAS:Zebrabow (C) reporter lines at 36 hpf. (D–G) mCherry expression upon treatment of Tg(krt5:Gal4-ERT-VP16; UAS:Zebrabow) animals with ethanol or the indicated dose of 4-OHT from 4–36 hpf. |
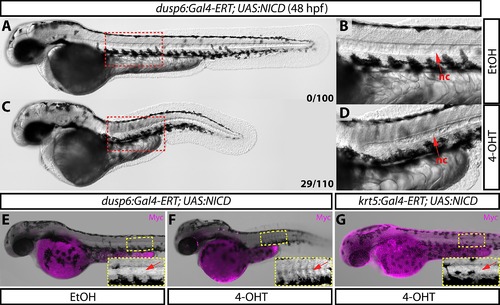
Tissue-specific notochord defects upon dusp6:Gal4-ERT driven NICD overexpression persist in 48 hpf zebrafish. (A–D) Differenial interference contract images of Tg(dusp6:Gal4-ERT-VP16; UAS:NICD) animals treated with either ethanol (A–B) or 4 μM 4-OHT from 2–48 hpf (C–D). Boxed regions in A and C are shown in higher magnification in B and D respectively. Red arrows indicate notochord. Numbers in A and C reflect the quantity of animals displaying a notochord defect in each treated population (25% double transgenic animals). (E–G) Bright-field images overlaid with anti-myc immunostaining (magenta) of Tg(dusp6:Gal4-ERT-VP16; UAS:NICD) (E–F) and Tg(krt5:Gal4-ERT-VP16; UAS:NICD) (G) fish demonstrate that notochord defects are only observed when UAS:NICD is driven by dusp6:Gal4-ERT (F). Boxed regions are shown in higher magnification in panel insets. Red arrows indicate the notochord (nc). |