
Fig. S3
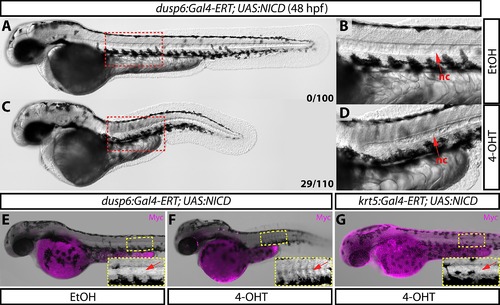
Tissue-specific notochord defects upon dusp6:Gal4-ERT driven NICD overexpression persist in 48 hpf zebrafish. (A–D) Differenial interference contract images of Tg(dusp6:Gal4-ERT-VP16; UAS:NICD) animals treated with either ethanol (A–B) or 4 μM 4-OHT from 2–48 hpf (C–D). Boxed regions in A and C are shown in higher magnification in B and D respectively. Red arrows indicate notochord. Numbers in A and C reflect the quantity of animals displaying a notochord defect in each treated population (25% double transgenic animals). (E–G) Bright-field images overlaid with anti-myc immunostaining (magenta) of Tg(dusp6:Gal4-ERT-VP16; UAS:NICD) (E–F) and Tg(krt5:Gal4-ERT-VP16; UAS:NICD) (G) fish demonstrate that notochord defects are only observed when UAS:NICD is driven by dusp6:Gal4-ERT (F). Boxed regions are shown in higher magnification in panel insets. Red arrows indicate the notochord (nc). |