
- Title
-
C2orf62 and TTC17 Are Involved in Actin Organization and Ciliogenesis in Zebrafish and Human
- Authors
- Bontems, F., Fish, R.J., Borlat, I., Lembo, F., Chocu, S., Chalmel, F., Borg, J.P., Pineau, C., Neerman-Arbez, M., Bairoch, A., and Lane, L.
- Source
- Full text @ PLoS One

zC2orf62 is expressed in ciliated structures during embryonic development and highly expressed in adult testis. (A) zC2orf62 mRNA levels measured by RT-qPCR at various developmental stages. zC2orf62 is highly expressed in adult testis and during almost all embryonic development. It is down-regulated at shield stage (6 hpf) and re-expressed at tail bud (12 hpf) when Kupffer′s vesicle forms. (B) Whole mount in situ hybridization of zC2orf62 mRNA at 24 hpf and 48 hpf. At 24 hpf, zC2orf62 mRNA is detected at the end of neural tube formation on the tail extremity (arrowhead), in pronephric ducts (P.D.) and in the brain (arrows). At 48 hpf, zC2orf62 is expressed in forebrain (B) and olfactory pits (O.P.) (arrows). Scale bars, 100 μm. (C) A construct containing zC2orf62 52-UTR, 32-UTR and potential regulatory sequences in which zC2orf62 coding sequence was replaced by EGFP was generated and inserted randomly inside the zebrafish genome. Resulting transgenic EGFP-zC2orf62 reporter fish were observed at 12 hpf using a fluorescent stereomicroscope and at 28, 48 and 96 hpf using a confocal microscope. EGFP is expressed at 12 hpf in Kupffer′s vesicle, and at 28 hpf in olfactory placode, eyes, brain, neural tube (N.T), and pronephric ducts (P.D). At 48 hpf, EGFP is expressed in ciliated cells of the olfactory organ (positive for μ-acetylated tubulin (red)). At 96 hpf, EGFP is also expressed in neuromast cells (N), olfactory sensory neurons (OSN) and in the ears (E and lower enlarged panel). Scale bars, 25 μm. See also Figs S1, S2. EXPRESSION / LABELING:
|
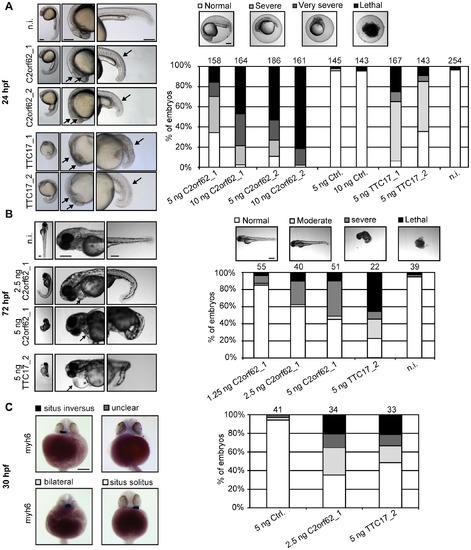
Knockdown of zC2orf62 or zTTC17 in embryos results in body curvature, head defects, and heart positioning defects. Zebrafish embryos were either not injected (n.i.) or injected with different quantities of Ctrl. MO, C2orf62_1 MO, C2orf62_2 MO, TTC17_1 MO or TTC17_2 MO and observed under a stereomicroscope. Scale bars, 200 μm. (A) Embryos injected with 5 ng C2orf62_1 MO, C2orf62_2 MO, TTC17_1 MO or TTC17_2 MO display the same phenotype at 24 hpf characterized by a curved body, a lack of defined brain structures or necrosis in the developing brain, and eye formation defects (arrows). Phenotypic traits were classified into four categories, each being associated with one grey code, as reported in the bar graph: normal (white, indistinguishable from controls), severe (clear grey, defect of brain structure formation and short body axis), very severe (dark grey, indistinguishable left/right or front/back polarity), and lethal (black). The bar graph shows the percentages of embryos in each category. Injection of 10 ng C2orf62_1 or C2orf62_2 MO or of 5 ng TTC17_1 MO results in >97% severe-to-lethal phenotypes. Injection of 5 ng C2orf62_1 or TTC17_2 MO results in about 65% severe-to-lethal phenotypes. See also the synergy between C2orf62_1 MO and C2orf62_2 MO in fig. S5. (B) Embryos were either not injected (n.i.), or injected with 1.25 to 5 ng C2orf62_1 MO or with 5 ng TTC17_2 MO, and observed at 72 hpf. Embryos injected with 5 ng C2orf62_1 or TTC17_2 MO display a curved body, incorrectly defined brain structures and heart edema (arrows). Injected embryos were classified into four categories, each being associated with one grey code, as reported in the bar graph: normal (white, indistinguishable from controls), moderate (clear grey, little body curvature and small heart edema), severe (dark grey, strong body curvature, brain defect morphology and edema), and lethal (black). The bar graph shows the percentages of embryos in each category. Injection of 5 ng C2orf62_1 or TTC17_2 MO results in about 50% severe-to-lethal phenotypes. (C) Embryos were labeled for myh6 at 30 hpf and classified into four categories according to the position of their heart (ventral views, scale bars, 200 μm): situs solitus (white), situs inversus (black), bilateral/midline positioning (light grey) and unclear/undeterminable positioning (dark grey). The bar graph shows the percentage of embryos in each category. About 20% of C2orf62_1 or TTC17_2 MO-injected embryos display situs inversus. See Figs S5 and S6 for further characterization of C2orf62_1 and C2orf62_2 MO. PHENOTYPE:
|

(related to Fig. 2). zC2orf62 is expressed in ciliated cells during embryonic development. Transgenic EGFP-zC2orf62 reporter zebrafish were observed using a confocal microscope. (A) At 48 hpf, immunostaining of α-acetylated tubulin (red) and EGFP (green) show a co-localization (yellow) in olfactory placode (OP), neuromast cells (N), ear (E) and pronephric ducts (P.D), and in cilia of olfactory sensory neurons (OSN). (B) At 96 hpf, EGFP is expressed specifically in ciliated neuromast cells and in hair cell-containing structures of the ear (cristae and macula). Scale bars, 25 μm. |
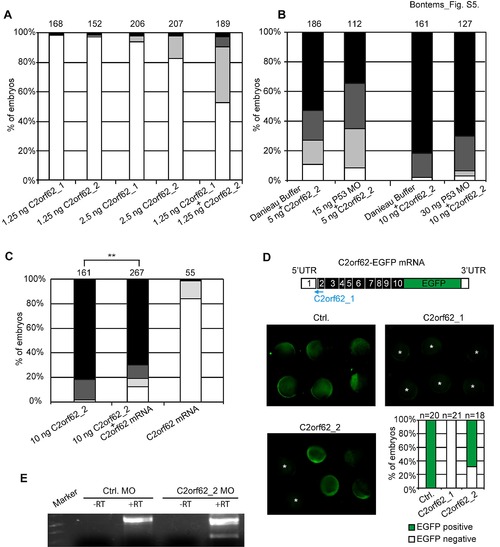
(related to. Fig. 6). Evaluation of the specificity of C2orf62 morpholinos. Zebrafish embryos were injected with different quantities of C2orf62_1 or C2orf62_2 MO and observed under a stereomicroscope. (A-C) Phenotypic traits at 24 hpf were classified into four categories, each being associated with one grey code, as reported in Fig. 6A: normal (white, indistinguishable from controls), severe (clear grey, defect of brain structure formation and short body axis), very severe (dark grey, indistinguishable left/right or front/back polarity), and lethal (black). The bar graphs show the percentage of embryos in each category. (A) Although the injection of 1.25 ng C2orf62_1 or C2orf62_2 MO has no effect on embryo morphology, the co-injection of 1.25 ng C2orf62_1 MO and 1.25 ng C2orf62_2 MO results in 47% of severe-to-lethal phenotypes, showing a strong synergy between both MOs. (B) Embryos were injected with 5 or 10 ng C2orf62_2 MO together with 0 (buffer alone), 15 or 30 ng P53 MO. Coinjection of P53 MO does not significantly change the phenotypes induced by injection of C2orf62_2 MO alone. (C) Embryos were injected with 10 ng C2orf62_2 MO and/or 2 ng full-length zC2orf62 mRNA. The percentage of normal (white) C2orf62_2 MO-injected embryos is significantly higher in the presence of mRNA (1.96% for C2orf62_2 MO alone and 12.53% for C2orf62_2 MO + RNA, P = 0.0044, Student′s t test). (D) Embryos were co-injected with 680 pg C2orf62-EGFP mRNA and 5 ng Ctrl. MO, C2orf62_1 MO or C2orf62_2 MO and observed 6 h later under a fluorescence stereomicroscope. EGFP signal was abrogated in all C2orf62_1 MO-injected embryos (star marked), and unexpectedly in 33% of C2orf62_2 MO-injected embryos. (E). RT-PCR analysis of total RNA extracted from 24 hpf embryos after injection of 5 ng of Ctrl. MO or C2orf62_2 MO shows that C2orf62_2 MO alters zC2orf62 splicing. |
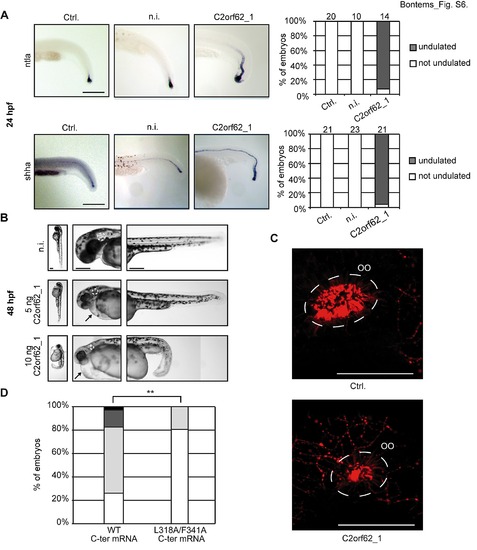
(related to Fig. 6). Knockdown of zC2orf62 results in notochord undulation and ciliogenesis defects in the olfactory organ. (A) In situ hybridization of ntla and shha at 24 hpf shows that more than 90% of C2orf62_1 MO-injected embryos have an undulated notochord, in contrast to controls (lateral views, scale bars, 200 μm). (B) Embryos were either not injected (n.i.) or injected with 5 or 10 ng C2orf62_1 MO and observed at 48 hpf. C2orf62_1 MO-injected embryos display a curved body, heart edema (arrow), and a small head with incorrectly defined brain structures, small eyes and small ears (dashed circle). Scale bars, 200 μm. (C) Embryos were injected either with 2.5 ng Ctrl. MO or C2orf62_1 MO, and ciliated cells from the olfactory organ (OO) were visualized using anti α-acetylated tubulin at 48 hpf. The olfactory organs of C2orf62_1 MO-injected embryos are smaller and display less ciliated cells than controls. Scale bars, 50 μm. (D) Embryos were injected with 850 pg mRNA coding for the C-terminal part (aa 276-356) of zC2orf62,either wild type (WT C-ter) or alanine-mutated on Leu-318 and Phe-341 (L318A/F341A C-ter), and observed 24 h later. Phenotypic traits were classified into four categories, each being associated with one grey code, as reported in Fig. 6A: normal (white, indistinguishable from controls), severe (clear grey, defect of brain structure formation and short body axis), very severe (dark grey, indistinguishable left/right or front/back polarity), and lethal (black). The bar graph shows the percentage of embryos in each category. The percentage of normal (white) embryos is significantly higher for L318A/F341A C-ter mRNA-injected embryos than for WT C-ter mRNA-injected embryos (25.7% for WT C-ter mRNA and 80.6% for L318A/F341A C-ter mRNA P = 0.0078, Student′s t test). |