
- Title
-
A comparative study of nucleostemin family members in zebrafish reveals specific roles in ribosome biogenesis
- Authors
- Essers, P.B., Pereboom, T.C., Goos, Y.J., Paridaen, J.T., and Macinnes, A.W.
- Source
- Full text @ Dev. Biol.
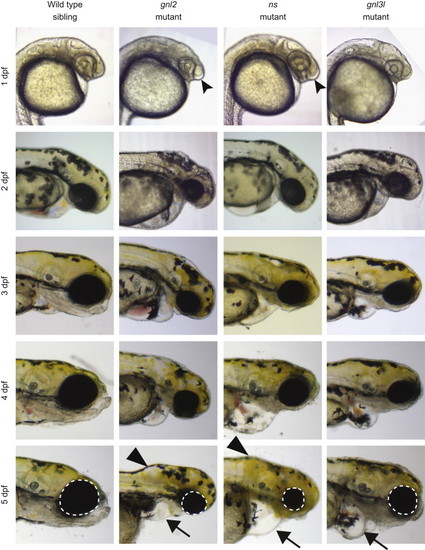
Morphology of ns family member mutants. Bright-field microscopy showing the morphological phenotypes of the mutants compared to a wild type sibling of gnl2 (there was no appreciable difference between wild type siblings of ns, gnl2, or gnl3l, therefore only gnl2 wild type siblings are shown for space reasons). The enlargement of the forebrain at 1 dpf is depicted with forked arrowheads. The inflation of the hindbrain ventricle is depicted at 5 dpf with arrowheads, and the cardiac edemas depicted with arrows. The size of the eyes at 5 dpf is illustrated with the white dotted circles. |
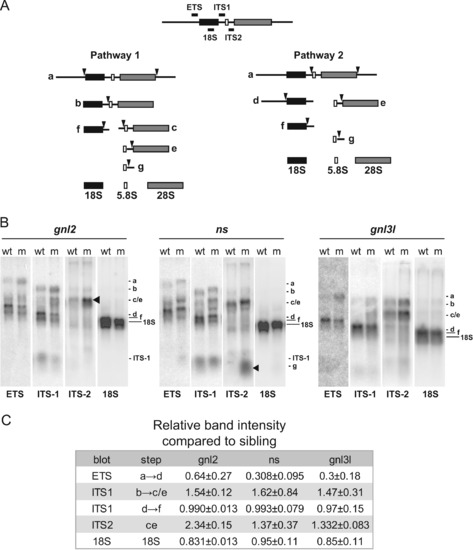
Specific rRNA processing defects are evident in ns and gnl2 mutants. (A) Simplified schematic of rRNA processing. The locations of the probes used and the processing intermediates visualized in (B) are indicated. (B) Northern blots showing reduced cleavage activity in various rRNA processing steps in gnl2, ns and gnl3l mutants at 2 dpf. The arrowheads indicate sites of major processing defects in the mutants. Results are representative of at least three independent experiments. (C) Relative band intensities were measured using ImageJ software and are represented relative to the wild type sibling for each mutant. p<0.01 by Student′s two-tailed t-test. PHENOTYPE:
|
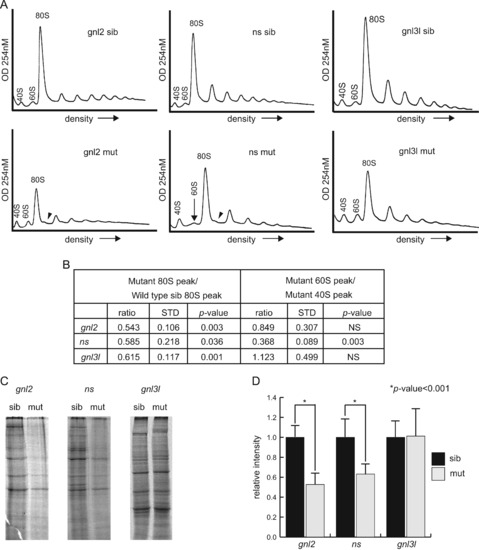
Polysome profiles reveal different effects of the mutations on ribosome biogenesis. (A) Polysome profiles of gnl2, ns and gnl3l mutants at 2 dpf. Location of the small (40S) and large (60S) subunits, as well as the monosome (80S) and halfmers (arrowheads) are indicated. The arrow indicates the collapsed 60S peak in the ns mutants. Results are representative of at least three independent experiments (shown in Fig. S1). (B) Quantification of peak sizes including profiles in Fig. S1. The ratios of the size of the mutant 80S peak to the wild type sibling 80S peak are shown on the left. The ratio of the mutant 60S peaks to the mutant 40S peaks are shown on the right. STD=standard deviation, NS=not significant. (C) Representative exposures of 35S-radiolabeled total protein synthesized in a 30-minute pulse in embryonic cells. (D) Quantifications of whole lane intensity in at least 3 samples (11 samples for gnl3l experiments). p<0.01 by Student′s two-tailed t-test. PHENOTYPE:
|
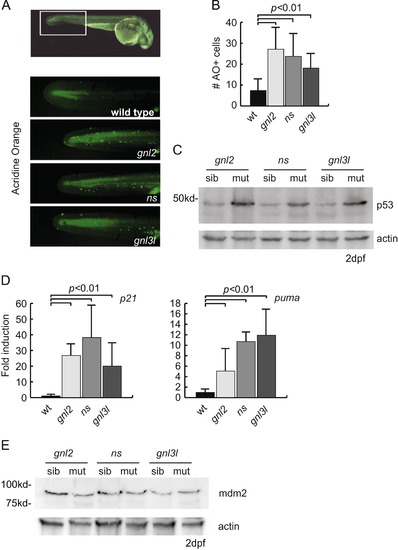
p53 induced apoptosis in ns family mutants. (A) Representative fluorescent microscopy images showing acridine orange staining at 1 dpf. The top box illustrates with the white box the portion of the tail used for quantification of acridine orange positive cells. (B) Quantifications of the number of acridine orange positive cells. At least 7 animals were blindly scored for these quantifications. p<0.01 by Student′s two-tailed t-test. (C) Western blot analysis of p53 stabilization in all three mutant lines at 2 dpf. (D) qPCR analysis of p21 and puma transcript levels at 2 dpf, normalized to ef1α expression. p<0.01 by Student′s two-tailed t-test. (E) Western blot analysis of zebrafish mdm2 levels in mutants and wild type siblings at 2 dpf. PHENOTYPE:
|
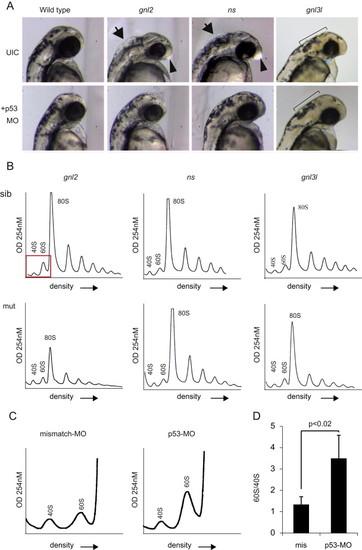
Loss of p53 partially rescues mutant phenotypes. (A) Bright field microscopy of p53 MO injections at 2 dpf. UIC=uninjected control embryos. Arrows depict inflation of the hindbrain ventricle, arrowheads depict enlargement of the forebrain. The ragged skin phenotype in gnl3l mutants and the rescue are depicted with the black bars. (B) Representative profiles of mutant embryos injected with the p53 MO. (C) Magnified representation of polysome profiles showing an increase in 60S peak size in p53 MO compared to missense MO injected embryos. (D) Quantification of the ratio of 60S to 40S peak size in missense vs. p53 MO injected embryos. PHENOTYPE:
|
Reprinted from Developmental Biology, 385(2), Essers, P.B., Pereboom, T.C., Goos, Y.J., Paridaen, J.T., and Macinnes, A.W., A comparative study of nucleostemin family members in zebrafish reveals specific roles in ribosome biogenesis, 304-15, Copyright (2014) with permission from Elsevier. Full text @ Dev. Biol.