
|
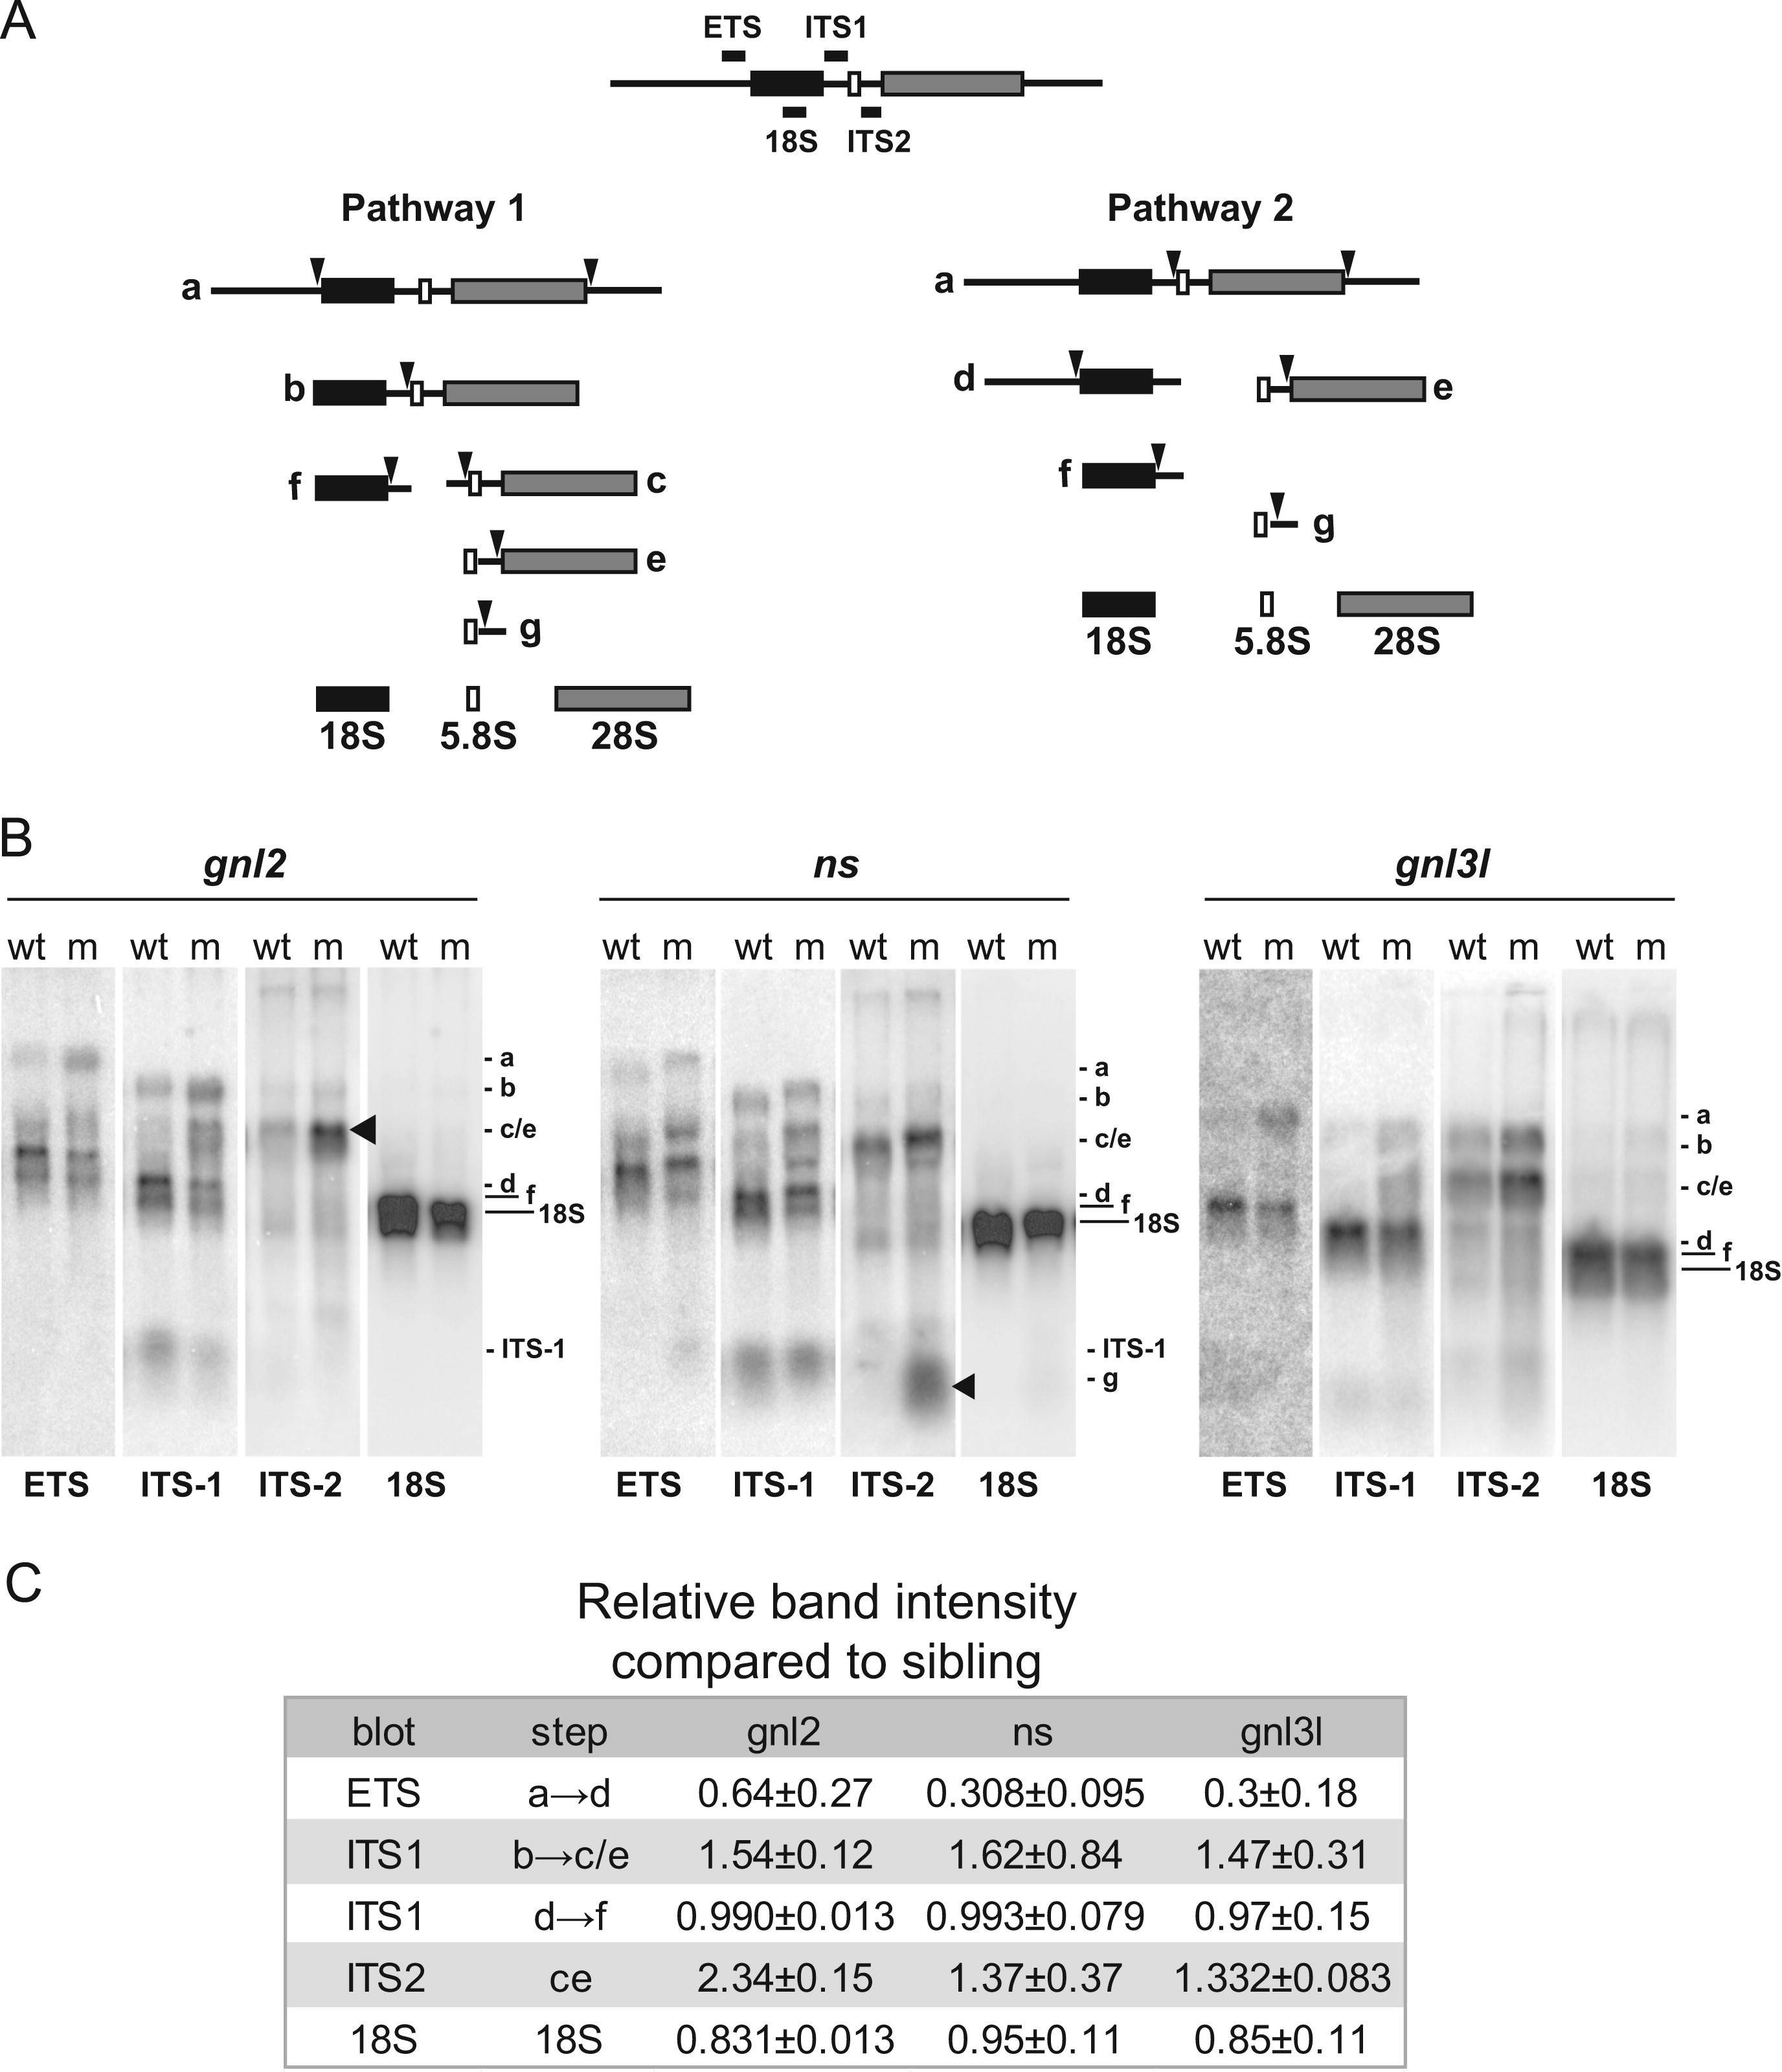
Fig. 3
Specific rRNA processing defects are evident in ns and gnl2 mutants. (A) Simplified schematic of rRNA processing. The locations of the probes used and the processing intermediates visualized in (B) are indicated. (B) Northern blots showing reduced cleavage activity in various rRNA processing steps in gnl2, ns and gnl3l mutants at 2 dpf. The arrowheads indicate sites of major processing defects in the mutants. Results are representative of at least three independent experiments. (C) Relative band intensities were measured using ImageJ software and are represented relative to the wild type sibling for each mutant. p<0.01 by Student′s two-tailed t-test.
Reprinted from Developmental Biology, 385(2), Essers, P.B., Pereboom, T.C., Goos, Y.J., Paridaen, J.T., and Macinnes, A.W., A comparative study of nucleostemin family members in zebrafish reveals specific roles in ribosome biogenesis, 304-15, Copyright (2014) with permission from Elsevier. Full text @ Dev. Biol.