
- Title
-
Real-time whole-body visualization of chikungunya virus infection and host interferon response in zebrafish
- Authors
- Palha, N., Guivel-Benhassine, F., Briolat, V., Lutfalla, G., Sourisseau, M., Ellett, F., Wang, C.H., Lieschke, G.J., Herbomel, P., Schwartz, O., and Levraud, J.P.
- Source
- Full text @ PLoS Pathog.

CHIKV replicates in zebrafish and disseminates to various organs. (A) Scheme of a 72 hours post-fertilization (hpf) larva, showing the site of injection in the dorsal aorta (DA) or caudal vein (CV), the caudal hematopoietic tissues (CHT) and the yolk syncitial cell (y). (B) Virus titers in zebrafish larvae infected with wild-type CHIKV-115 or with CHIKV-GFP. Data represent mean � s.e.m of 2?5 pools of 4 larvae from 5 independent experiments. (C) qRT-PCR of viral E1 and GFP transcripts after CHIKV-GFP infection. Mean � s.e.m of 3 pools of 10 larvae from 3 independent experiments. (D) Overlay of transmission and green fluorescence stereomicroscope images of a single representative wild-type CHIKV-GFP-infected larva, live imaged at different hours post infection (hpi). CHIKV infection is shown in the brain, liver, head mesenchyme, muscle, swim bladder and yolk (red, green, yellow, blue, white and magenta arrowheads, respectively). (E) Assessment using fluorescence stereomicroscopy of penetrance (% of infected larvae displaying infection) and severity (number of cells) of infection in specific organs at different time-points after CHIKV-GFP infection, following immunohistochemistry (IHC) with an anti-capsid antibody. Data pooled from 2 independent experiments, N = 20 larvae for each time-point. |
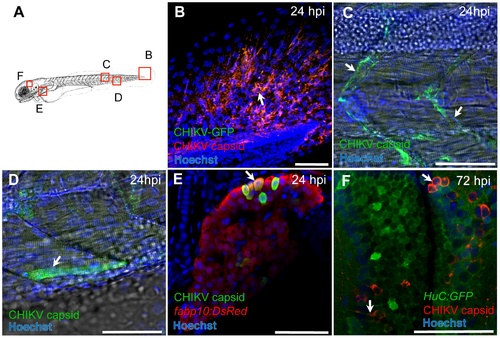
Cellular tropism of CHIKV. (A) Scheme of imaged regions in (B?F). (B?F) Confocal images of IHC-processed zebrafish at 24 hpi with CHIKV-GFP (B?E) or at 72 hpi with CHIKV-115 (F). As for all images, anterior to left, dorsal to top; scale bars, 50 μm. GFP staining in green in (B, F) DsRed staining in red in (E), capsid staining in red (B, F) or green (C?E); nuclei counterstained in blue. The fabp10:dsRed transgene labels hepatocytes, and HuC:GFP, post-mitotic neurons. Arrows show infection in fin fibroblasts (B), endothelial cells (C), a muscle fiber (D), hepatocytes (E) and neurons (F). |
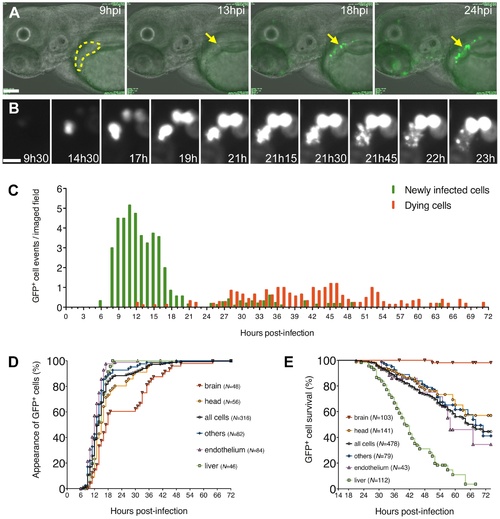
Kinetics of appearance and death of infected cells, from in vivo time-lapse imaging of CHIKV-GFP infection. (A, B) Movie frames showing emergence of infected cells (GFP+) in the liver and death of one cell during the first day of infection. Time post-infection (in hours and minutes) overlaid on images. (A) Entire field, overlay of transmission and GFP fluorescence (green), scale bar 100 �m. Liver delineated in yellow; arrows point to an hepatocyte becoming infected and dying. (B) Detail from the same movie, GFP fluorescence only, scale bar 20 μm, showing the rise and death of this infected hepatocyte. (C) Timings of appearance (green bars) and death (red bars) of immobile CHIKV-GFP infected cells, all organs pooled; (D, E) sub-analysis of the same dataset, showing kinetics of appearance (D) and death (E) of GFP+ cells per organ, displayed as Kaplan-Meier plots. N = Number of cells followed in each organ. In (C?E) data pooled from five independent experiments, with a total 24 fish imaged for 6?24 hours each, 4?8 animals per time-point. |

A protective interferon response is induced upon CHIKV infection. (A?C) Expression of zebrafish type I IFNs ifnφ1 (A) and ifnφ3 (B) and the IFN-stimulated gene viperin (C), upon CHIKV-GFP infection. qRT-PCR, mean � s.e.m of 3 pools of 10 larvae from 3 independent experiments. (D?F) Effect of morpholino-mediated knockdown of IFN receptor subunits (CRFB1+2 MO) and of MAVS (MAVS MO) on CHIKV-GFP infection. No MO, not injected with a morpholino; No V, uninfected controls; Control MO, injected with a unspecific morpholino oligonucleotide. (D) Disease score at 3 days post-infection; (E) survival of infected zebrafish; (F) quantification of viral E1 transcripts over time. qRT-PCR, mean � s.e.m of 3 pools of 3?5 larvae, except for the CRFB morphants at 72 hpi (one single pool of 5 larvae). Hatched bars represent groups where a fraction of the fish had already died, implying selection of survivors for the analysis. ND, not determined. (G) Pattern of ifnφ1 expression, whole-mount in situ hybridization in uninfected larva (top) or CHIKV-GFP infected larva (bottom) at 24 hpi, representative out of 7 fish. Arrows indicate some ifnφ1+ leukocytes, arrowhead point to an ifnφ1+ hepatocyte; L = liver. (***P < 0.001; **P < 0.01; *P < 0.05; ns - not significant). EXPRESSION / LABELING:
PHENOTYPE:
|
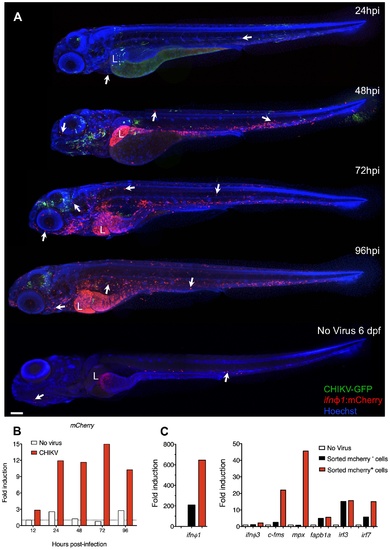
Ifnφ1-expressing cells are leukocytes and hepatocytes. (A) Distribution of ifnφ1-expressing cells revealed by the ifnφ1:mCherry reporter transgene. IHC, mCherry stained in red, GFP in green, nuclei in blue. Confocal imaging, reconstructed composite images of maximal projections to cover the whole body. Representative examples of CHIKV-GFP-infected fish at different time points after infection. Below is an uninfected control at the equivalent of 72 hpi. Arrows indicate some mCherry+ leukocytes, L = liver. Scale bar, 100 μm. (B) qRT-PCR of mCherry (normalized to ef1α) upon CHIKV-GFP infection in ifnφ1:mCherry fish. Fold induction to uninfected fish at 12 hpi; data for one pool of 10 larvae per time point. (C) Expression profile of FACS-sorted cells from CHIKV-infected ifnφ1:mCherry fish (3 dpi). qRT-PCR, fold induction compared to entire uninfected fish (No Virus). Data representative of 2 independent experiments. |
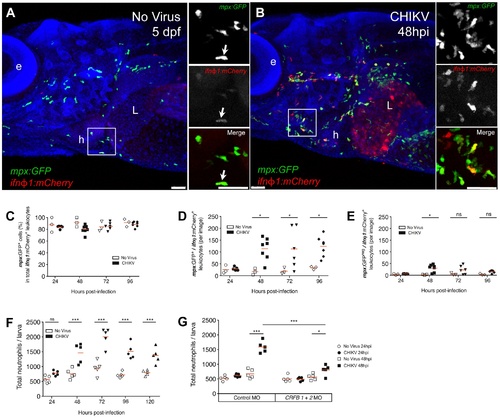
Ifnφ1-expressing leukocytes are mostly neutrophils, which increase in an IFN-dependent manner. (A?E) IHC of anterior region of mpx:GFP/ifnφ1:mCherry double transgenic fish. (A?B) Confocal imaging of an uninfected (A) and CHIKV-115-infected (B) larva at 48 hpi, maximal projection, scale bar 50 μm, mCherry staining in red, GFP staining in green, nuclei in blue (e: eye; L: liver; h: heart); on the right, single color and merged images of the detailed square. (C) Percentage of neutrophils (GFP+) among mCherry+ leukocytes, per field. (D) Number of mCherry+ neutrophils (GFP+) per field. (E) Number of other mCherry+ leukocytes (GFP) per field. For (C?E), N = 3 (No Virus) or N = 5?7 (CHIKV). (F, G) Uninfected or CHIKV-GFP-infected larvae were stained with Sudan Black B to reveal myeloperoxidase granules. Total neutrophil numbers per individual zebrafish were quantified using a stereomicroscope. (F) Neutrophil numbers over time in standard (no morpholino treatment) animals; (G) Neutrophils numbers in interferon receptor knockdown fish (CRFB1+2 MO) compared to control morphants. N = 5 fish per group (***P < 0.001; **P < 0.01; *P < 0.05; ns - not significant). |

Neutrophils are key ifnφ1-producing cells. (A-C) Effect of myeloid cell depletion (PU.1 MO, 3 independent experiments), (D-F) of macrophage depletion (metronidazole treatment of mpeg1:Gal4/UAS:NfsB-mCherry fish, 2 independent experiments), (G-I) of neutrophil-biased depletion (csf3r MO, 2 independent experiments), (J-L) of impairment of emergency granulopoiesis (nos2a MO, 2 independent experiments) and (M-O) of hepatocyte depletion (Tomm22 MO, 2 independent experiments) on CHIKV infection. (A, D, G, J and M) Disease score at 3 dpi. (B, E, H, K and N) Survival of infected zebrafish. Data pooled from the independent experiments. (C, F, I, L and O) qRT-PCR of viral E1 transcripts at 24 hpi. Mean � s.e.m of 6 pools of 5 larvae from 2 (C, F, L) or 1 (I, O) independent experiments. (***P < 0.001; **P < 0.01; *P < 0.05; ns - not significant). PHENOTYPE:
|