
- Title
-
Wnt signaling regulates postembryonic hypothalamic progenitor differentiation
- Authors
- Wang, X., Kopinke, D., Lin, J., McPherson, A.D., Duncan, R.N., Otsuna, H., Moro, E., Hoshijima, K., Grunwald, D.J., Argenton, F., Chien, C.B., Murtaugh, L.C., and Dorsky, R.I.
- Source
- Full text @ Dev. Cell

Identification of Wnt-Responsive Cells in the Zebrafish Hypothalamus (A) Ventral view of TCFSiam:GFP. (B) Costaining with PCNA, Sox3, and Hu. Blue ovals label the presumptive lateral recess, and red ovals label the presumptive posterior recess. White box in (A) marks the area shown. (C) Maximum intensity confocal Z-projection of TCFSiam:GFP at 4 dpf. In nuclear stained ventral view of brain on left, white box marks hypothalamic area shown on right. Red oval marks the posterior recess. (D) Costaining of TCFSiam:GFP with PCNA, Sox3, and HuC/D. Yellow box in (C) marks the area shown. (E) Costaining of TCFSiam:GFP with dlx5/6:gfp and serotonin. Yellow box in (C) marks the area shown. (F) Dissecting microscope ventral and sagittal views of TCFSiam:GFP in the adult hypothalamus. Red oval labels the presumptive posterior recess. (G) Costaining of TCFSiam:GFP with Sox3, Hu, 5HT, dlx5/6:mCherry, and GABA in the adult posterior hypothalamus. Yellow box in (F) marks the area shown. Single optical sections from ventral views are shown in all panels, unless otherwise indicated. Small orange circles label cells with colocalization, and small magenta circles label cells without colocalization. Scale bars represent 80 μm (A?E,G), and 250 μm (F). See also Figure S1. |
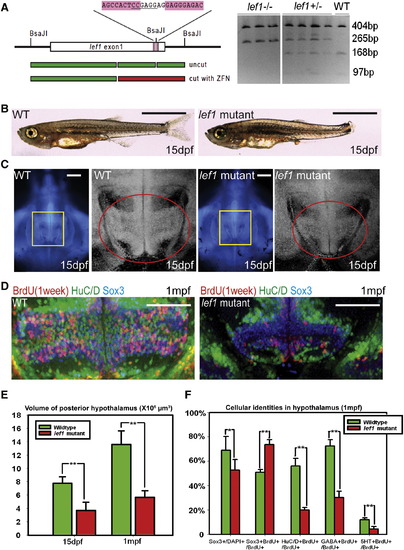
lef1 Is Required for Proliferation and Neurogenesis in the Postembryonic Hypothalamus (A) lef1 ZFN target region and genotyping. (B and C) Whole fish (B) and brain size (C) comparisons of lef1 mutant to wild-type at 15 dpf. Boxed region in left panel is enlarged on right, posterior recess is circled. (D) Expression of HuC/D, Sox3, and 7-day BrdU labeling in posterior recess of wild-type and lef1 mutant hypothalamus. (E) Quantification of posterior hypothalamus size. (F) Tracing of proliferating cells. lef1 mutants have a smaller Sox3+ progenitor pool, but a higher percentage of BrdU+ cells express Sox3 and fewer produce HuC/D+, GABA+, or 5HT+ neurons. Single optical sections from ventral views are shown in (C) and (D). Scale bars represent 2 mm (B), 200 μm (C), and 100 μm (D). Brain volumes were calculated using Amira software. Cell counts were collected from maximum intensity Z projections through the posterior recess of three individual samples for each genotype and calculated using Volocity software. *p < 0.05, **p < 0.005. Error = �SD. See also Figure S3. EXPRESSION / LABELING:
PHENOTYPE:
|
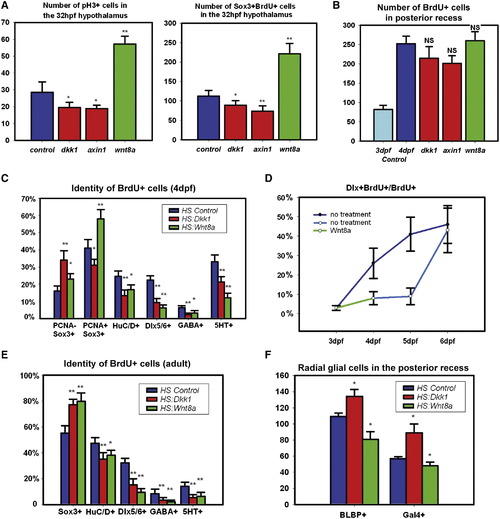
Wnt Signaling Regulates Hypothalamic Progenitor Proliferation and Differentiation (A) pH3+ and BrdU+/Sox3+ cell numbers in the 32hpf hypothalamus following 2 hr labeling and Wnt pathway inhibition or activation at 24 hpf. (B) BrdU+ cell numbers in the 4 dpf posterior recess following 2 hr labeling and Wnt pathway inhibition or activation at 3 dpf. (C) BrdU+ cell fates in the 4 dpf hypothalamus following labeling and Wnt pathway inhibition or activation at 3 dpf. (D) Percentage of BrdU+ cells expressing dlx5/6:gfp following Wnt pathway activation at 3 dpf. (E) BrdU+ cell fates in the adult hypothalamus following 2-day labeling and Wnt pathway inhibition or activation for 15 days. (F) Number of Gal4+ and BLBP+ cells in the 4 dpf posterior recess following Wnt pathway inhibition or activation at 3 dpf. All cell counts were collected from ventral maximum intensity confocal Z projections through five individual brains. The entire hypothalamus was counted at 32 hpf, the entire posterior recess was counted at 4 dpf, and a hemisphere of the posterior recess was counted in adults. * p < 0.05, ** p < 0.005. Error = �SD. See also Figure S4. |

Wnt Signaling Inhibits the Formation of Radial Glia in the Posterior Recess at 4 dpf (A) Coexpression of mCherry driven by the Gal4 zc1066a insertion with the radial glial marker BLBP. (B) Coexpression of Gal4-driven Kaede with the radial glial marker glutamine synthetase. (C) Costaining for Sox3 and Gal4-driven Kaede. Most Gal4+ cells have low or absent Sox3 expression. (D) Costaining for TCFSiam:GFP and Gal4-driven mCherry. Few Gal4+ cells show Wnt reporter activity. (E and F) Gal4 zc1066a-driven mCherry (E) and BLBP (F) expression in the posterior recess of 4 dpf embryos following Wnt pathway inhibition or activation at 3 dpf. Single ventral confocal optical sections are shown in all panels. Scale bar represents 80 μm. |
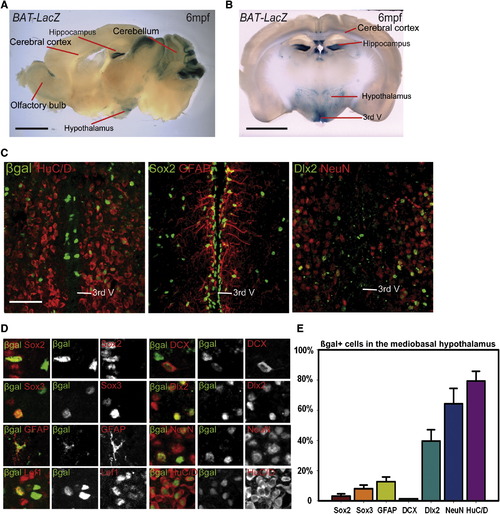
The Adult Mouse Hypothalamus Has a Wnt-Responsive Cell Population (A and B) Sagittal (A) and coronal (B) sections of adult Bat-LacZ mouse brains. (C) β-gal+ cells are distributed in both the ventricular zone (where Sox2+ and GFAP+ cells reside) and the parenchymal zone (where Sox2, HuC/D+, NeuN+, and Dlx2+ cells reside) Coronal 40μm cryosections are shown. (D) Colocalization of β-gal with specific markers in the hypothalamus. (E) Percentage of marker coexpression within the β-gal+ population. Single confocal optical sections are shown in (C) and (D). Scale bars represent 2 mm (A and B), and 80 μm (C). Cell counts were collected from the mediobasal hypothalamus, using six 40μm cryosections each from three mice. Error = �SD. |
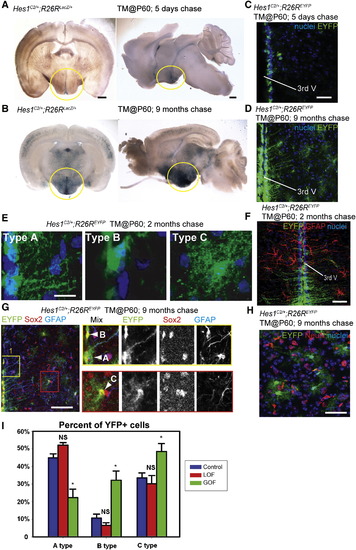
Wnt Signaling Inhibits the Production of Tanycytes from Adult Hes1+ Progenitors (A and B) Coronal and sagittal sections of adult Hes1C2/+; R26RLacZ/+ mouse brains, 5 days and 9 months after TM administration at P60. (C and D) Coronal cryosections through the hypothalamus of adult Hes1C2/+; R26REYFP/+ mouse brains, 5 days and 9 months after TM administration at P60. (E) The three types of EYFP+ cells observed at 2 months post-TM. (F) Expression of EYFP and GFAP in Hes1C2/+; R26REYFP/+ mice 2 months post-TM. (G and H) Marker analysis of Hes1C2/+; R26REYFP/+ mice 9 months post-TM. Boxes in (G) show enlarged ventricular (yellow) and parenchymal (red) zones in which cell types are indicated by arrowheads. All EYFP+ cells are Sox2+, and some ventricular Type A cells are also GFAP+. (H) Expression of EYFP and NeuN+ in the parenchymal zone, where no colabeled cells are observed. (I) Percentage of Type A, B, and C EYFP+ cells 2 months following β-catenin inactivation or activation. Single confocal optical sections are shown in (C?H). Scale bars represent 1 mm (A and B), 80 μm (C, D, F, G, and H), and 10 μm (E). Cell counts were collected from the mediobasal hypothalamus, using six 40 μm sections from three mice for each genotype. *p < 0.05. Error = �SD. |
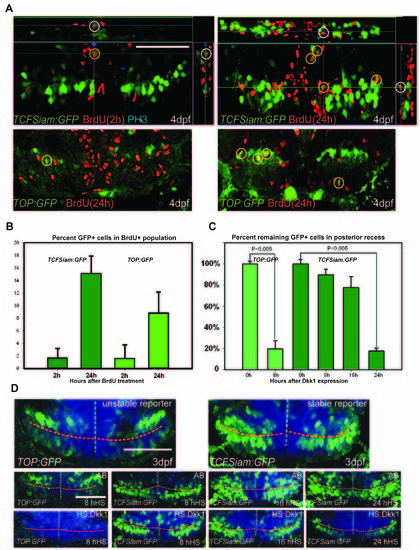
Analysis of Wnt reporter at 4dpf, related to Figure 1. (A) Ventral view of the posterior recess region of TOP:GFP and TCFSiam:GFP hypothalamus after short (2h) and long term (24h) BrdU labeling; observed with 50μm maximum intensity confocal Z-projections. (B) Quantification of BrdU+/GFP+ cells 2 hours or 24 hours after labeling. (C) Relative percentages of GFP+ cells following hs:dkk1 expression at 3dpf, compared to wild-type controls. (D) Ventral view of the posterior recess region of TOP:GFP and TCFSiam:GFP embryos, 8h, 16h, and 24h after hs:dkk1 activation at 3dpf. Images are 50μm ventral maximum intensity confocal Z-projections. Scale bars: 80μm. Cell counts were collected from ventral maximum intensity confocal Z-projections through the posterior recess of 3 individual samples for each condition. Error=�SD. |
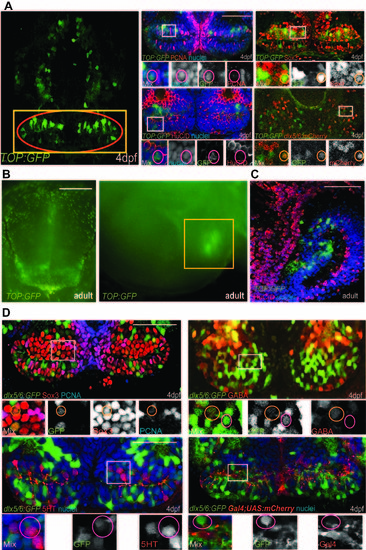
Identity of reporter-labeled cells, related to Table 1. (A) Maximum-intensity confocal ventral projection of 4dpf TOP:GFP hypothalamus on left, yellow box marks the area shown on right and red oval marks the posterior recess. Co-staining of GFP with cell-type specific markers is shown on right. (B) Dissecting microscope images of TOP:GFP expression in the adult hypothalamus, from ventral and mid-sagittal views. Yellow box marks the area shown in (C). (C) Co-staining of GFP and HuC/D in the adult hypothalamus. (D) dlx5/6:GFP expression overlaps with Sox3, PCNA, and GABA, but not with 5HT or a Gal4 insertion expressed in radial glia (C). White boxes indicate enlarged regions. Small orange circles label cells with colocalization and small magenta circles label cells without colocalization. Single confocal optical sections are shown unless otherwise indicated. Scale bars: Scale bars: (A,C,D) 80μm, (B) 250μm. |

Expression of Wnt pathway components in zebrafish hypothalamic neural progenitors, related to Figure 2. (A,B) wnt8b mRNA, lef1 mRNA, and tcf7:GFP expression at 32hpf (A), and 4dpf (B) in ventral whole-mount views. (C) Co-expression of tcf7:GFP in the 4dpf hypothalamus with cell-type specific markers. (D) Bright-field and fluorescent dissecting microscope ventral images of the adult hypothalamus expressing tcf7:GFP. Yellow box in the bright field image indicates the region magnified in the fluorescent image. (E) Mid-sagittal view of wnt8b mRNA, lef1 mRNA, and tcf7:GFP expression in the adult hypothalamus. Yellow box in the left image indicates the region magnified in the right images. Blue line: 3rd ventricle; Red line: Posterior recess. A 12μm transverse cryosection is shown for Lef1 staining in (C), all other panels show single confocal optical sections from ventral views unless otherwise indicated. Scale bars: (A,B) 50μm, (C) 80μm, (D,E) 250μm. |

Effects of Wnt signaling on hypothalamic progenitors, related to Figure 3. (A) Ventral confocal optical sections of TUNEL staining at 4dpf, and counts of TUNEL+ cells at 32hpf and 4dpf. Only hs:axin1 expression from 3-4dpf significantly increases cell death compared to heat shock alone. (B) axin2 in situ hybridization at 4dpf following heat shock at 3dpf. (C) axin2 in situ hybridization in a mid-sagittal section of the adult hypothalamus. Red oval marks posterior recess. (D) axin2 mRNA expression levels in the dissected adult hypothalamus following Wnt pathway inhibition or activation for 15 days. (E) Phospho-Histone H3 staining in the 32hpf hypothalamus (yellow squares). (F) Co-localization of BrdU labeling with Sox3 and dlx5/6:GFP labeling in the 4dpf and adult posterior recess. Single confocal optical sections are shown in all panels. Scale bars: (A,C,F) 80μm, (B) 25μm, (E) 50μm. Cell counts were collected from ventral maximum intensity confocal Z-projections through 3 individual brains. The entire hypothalamus was counted at 32hpf, and the entire posterior recess was counted at 4dpf. **: p<0.05 compared to non-HS control. Error=�SD. PHENOTYPE:
|
Reprinted from Developmental Cell, 23(3), Wang, X., Kopinke, D., Lin, J., McPherson, A.D., Duncan, R.N., Otsuna, H., Moro, E., Hoshijima, K., Grunwald, D.J., Argenton, F., Chien, C.B., Murtaugh, L.C., and Dorsky, R.I., Wnt signaling regulates postembryonic hypothalamic progenitor differentiation, 624-636, Copyright (2012) with permission from Elsevier. Full text @ Dev. Cell