
- Title
-
The Apoptotic Regulator Nrz Controls Cytoskeletal Dynamics via the Regulation of Ca(2)+ Trafficking in the Zebrafish Blastula
- Authors
- Popgeorgiev, N., Bonneau, B., Ferri, K.F., Prudent, J., Thibaut, J., and Gillet, G.
- Source
- Full text @ Dev. Cell

Nrz Protein Is Located into YSL Mitochondria and ER (A) Schematic drawing of a zebrafish embryo representing a simplified model of yolk organization. YSL contains a large number of nuclei present beneath the blastoderm. The region populated with yolk nuclei presents a dense network of microtubules from which originates a parallel microtubule network oriented along the animal-vegetal axis and extending into the yolk cell layer. MT, microtubules; YSL, yolk syncytial layer; YCL, yolk cell layer. (B) Transmission electron microscopy image of the interface region between the YSL and the deep cells showing the presence of numerous mitochondria inside the blastomeres and the YSL (white arrowheads). Membranes reminiscent from ER are visible in the vicinity of a YSL nucleus (red arrows). Scale bar: 2 μm. (C) Confocal section of zebrafish embryo stained in vivo with Mitotracker Red in the margin region showing the presence of a belt of mitochondria in the YSL (arrowhead). (D) Confocal section of zebrafish embryo expressing recombinant EGFP targeted into the ER membrane (ER-GFP); a fluorescent signal can be detected in the YSL (arrowhead). White rectangles materialize regions observed at higher magnification (right panels). AP, animal pole; VP, vegetal pole. (E) Immunoblot of whole embryo (before MBT stage) or blastomere and yolk mitochondrial extracts (sphere-oblong, 30%–50%, or 75% epiboly stages) showing the presence of Nrz protein in the yolk mitochondrial fraction. F0/F1 ATPase is used for calibration. (F) Confocal microscopy analysis. Detection of ER-GFP (green, left) and endogenous Nrz protein (red, middle) at the margin (50% epiboly). Merged images show colocalization of ER-GFP and Nrz (yellow, right). Dashed line separates blastomeres from YSL. Scale bar: 20 μm. Specificity of the anti-Nrz antibody was assessed using Nrz-depleted embryos as negative control (see Figure S1). (G) Subcellular fractionation of YSL mitochondria and YSL ER of ER-GFP-expressing embryos (75% epiboly). Nrz is detected in the endoplasmic reticulum fraction (ER) and to a lesser extent in the mitochondrial fraction (Mito), being absent in the cytosolic fraction (SN). VDAC and GFP antibodies were used as mitochondrial marker and ER marker, respectively. See also Figure S1. EXPRESSION / LABELING:
|
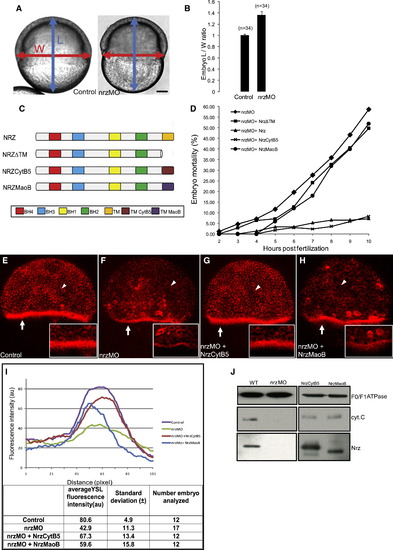
Effect of nrz Knockdown and Nrz Subcellular Localization on Epiboly and YSL Mitochondria (A) Embryo length (L) and width (W) used for calculating the L/W ratio; left: control embryo; right: nrz morphant. (B) Histogram showing the L/W ratio of control embryos (WT) and nrz morphants (nrzMO) at 50% epiboly/shield stage (mean ± SD; three independent experiments; p < 0.01). (C) Schematic drawing of recombinant proteins. Nrz, full-length protein; NrzΔTM, deletion mutant lacking the TM domain; NrzCytB5, swap mutant with ER-addressing domain; NrzMaoB, swap mutant with mitochondria-addressing domain. BH and TM domains are shown as color boxes. (D) Complementation experiments: Embryos were injected with nrz morpholinos to dampen endogenous nrz level and coinjected with mRNAs expressing the recombinant proteins displayed in (C). Embryo mortality (%) was measured at indicated (hours postfertilization). Representative data from 2–8 independent experiments. The nrz morpholino is directed against the 5′ untranslated region of the endogenous nrz mRNA; it does not match with the foreign nrz transcripts. (E–H) Representative confocal images of Mitotracker Red-stained embryos injected with control morpholino (E), nrzMO morpholino (F), nrzMO + nrzcytb5 mRNA (G), or nrzMO + nrzmaob mRNA (H); nrzMO-injected embryos exhibit a dramatic decrease in the labeling of the YSL mitochondria belt (white arrows). (I) Quantitative analysis of Mitotracker labeling of zebrafish embryos. Fluorescence intensity is represented as a function of the distance from the animal pole (upper panel). Intensity peaks in the region of the YSL. Statistical data are shown (bottom panel). (J) Immunoblot analysis of Nrz protein and cytochrome c contents of purified YSL mitochondria; F0/F1 ATPase was used as a loading control. Left: mitochondrial protein extracts from control embryos and nrz morphants; loss of Nrz protein correlates with cytochrome c release. Right: same analysis carried out on nrz morphants coinjected with mRNAs expressing NrzCytB5 or NrzMaoB; cytochrome c release appears to be prevented by both Nrz swap mutants. See also Movie S1 and Figure S2. PHENOTYPE:
|
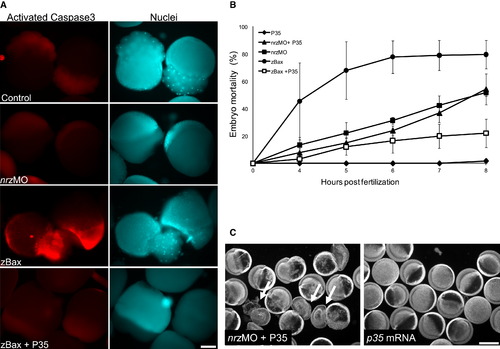
Nrz Knockdown Results in Caspase-Independent Epiboly Arrest (A) Left panels: activated caspase-3 staining of embryos injected at the one cell stage with egfp mRNA (control), nrzMO (0.5 mM), zbax mRNA, or zbax mRNA plus p35 mRNA. Zbax-expressing embryos were stained at the two to eight cell stage, whereas nrz morphants were labeled at the 30%–50% epiboly stage. Right panels: same embryos stained with Hoechst′s reagent to visualize nuclei. Scale bar: 200 μm. (B) Mortality rate of control zebrafish embryos injected with p35 and zbax mRNA either alone or in combination and of nrz morphants coinjected or not with p35 mRNA (mean ± SD; three independent experiments). (C) Bright-field images showing the phenotype of control embryos and nrz morphants injected with p35 mRNA. Scale bar: 500 μm. EXPRESSION / LABELING:
|
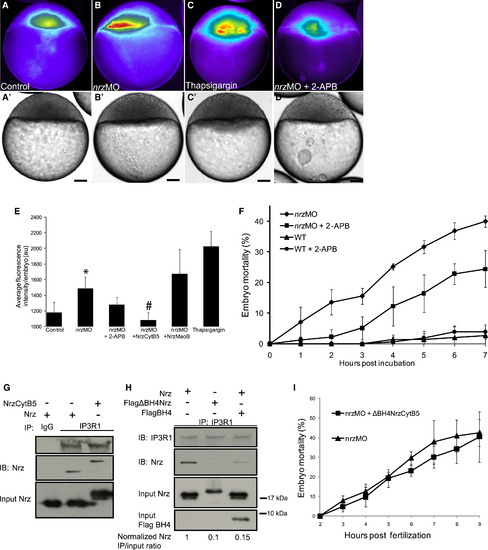
Nrz Binds to IP3R1 via Its BH4 Domain and Controls Intracellular Ca2+ Levels in Zebrafish Embryos (A–D) Fluorescence microscopy images of control embryos (A), nrz morphants (B), WT embryos treated with thapsigargin (C), or nrz morphants treated with or 2-APB (D); embryos were stained with Oregon Green BAPTA-1 AM (false colors, oblong-sphere stage). Increased signal in thapsigargin-treated embryos and nrz morphants reveals the release of free Ca2+ in the region of the margin from which originates the YSL. In (A′–D′), bright-field images of the same embryos are shown. Scale bar: 100 μm. (E) Quantification of Oregon Green BAPTA-1 AM staining of control embryos and of nrz morphants injected or not with nrzcytb5 or nrzmaob mRNAs or treated with 2-APB (50 μM); embryos treated with thapsigargin alone (20 μM) were used as positive controls (mean ± SD; three independent experiments; *p < 0.01 versus control embryos; #p > 0.9 versus control embryos). (F) Effect of IP3R inhibition with 2-APB on the mortality of zebrafish embryos. Control embryos (WT) and nrz morphants (MO) were incubated or not with 2-APB (50 μM) from 512 cells to oblong-sphere stage. Mortality was evaluated at indicated times after the beginning of the incubation (mean ± SD; three independent experiments). (G and H) Immunoprecipitation experiments with protein extracts from transfected HeLa cells: Nrz and NrzCytB5 coimmunoprecipitated with the IP3R1 channel (G); Nrz but not ΔBH4Nrz was able to interact with IP3R1 (H); the Flag-tagged BH4 peptide domain inhibited Nrz/IP3R1 interaction. Bottom: densitometry quantification, Nrz IP/input ratios obtained by calculating the ratio of IP band intensity (lanes “IB:Nrz”) to the input band intensity (lanes “Input Nrz”). (I) Time course analysis of nrz morphants injected or not with in vitro synthesized ΔBH4NrzCytB5 mRNA. Ectopic expression of ΔBH4NrzCytB5 is unable to prevent nrzMO lethal phenotype (mean ± SD; three independent experiments). See also Figure S3. PHENOTYPE:
|
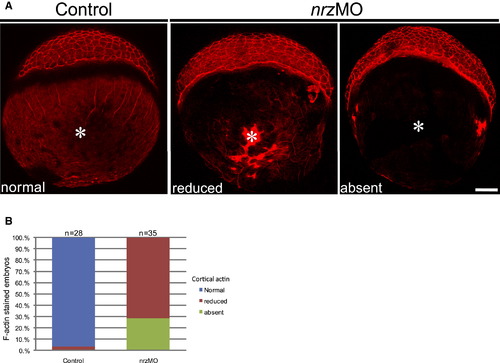
Nrz Knockdown Leads to Profound Alterations of the Cytoskeleton Inside the Yolk Cell (A) F-actin staining in control embryos and nrz morphants at 40%–50% epiboly stage showing the status of cortical F-actin inside the vegetal pole (white asterisk). In nrz morphants, cortical actin is severely reduced or absent. (B) Histogram showing the percentage of control embryos versus nrz morphants at 50% epiboly stage with normal (blue), reduced (red), or absent (green) cortical F-actin. See also Figure S4. PHENOTYPE:
|
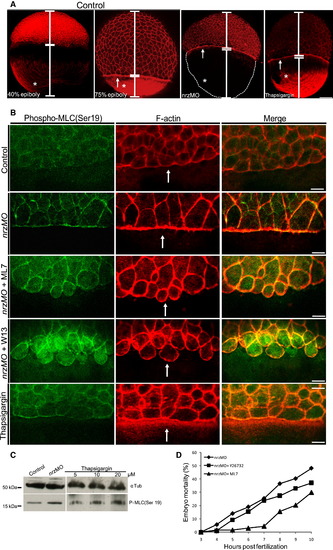
Nrz Knockdown Leads to Increased Myosin Phosphorylation at the Margin and Premature Actin-Myosin Contractile Ring Formation (A) F-actin staining of control embryos (40% and 75% epiboly), nrz morphants (nrzMO), and thapsigargin-treated (5 μM) embryos. In control embryos, the actin-myosin ring is present at 75% epiboly but absent at 40% epiboly (white arrows). In nrz morphants the actin-myosin ring is already present before migrating blastomeres reached the equator. White asterisks materialize the location of vegetal F-actin inside the yolk cell. Scale bar: 100 μm. (B) Immunofluorescence analysis of the margin region of 50% epiboly stage embryos: staining of phospho-MLC of nrz morphants versus control embryos showing MLC phosphorylation at the margin in nrz morphants, which is correlated with an increase in the F-actin signal (phalloidin staining). Merged images are shown on the right. Treatment of nrz morphants with the MLCK inhibitor ML7 or the calmodulin antagonist W13 inhibits MLC phosphorylation and F-actin polymerization. Thapsigargin-treated embryos were used as positive controls. Scale bar, 20 μm. Representative data from at least three embryos (50% epiboly). (C) Immunoblot analysis of the phospho-MLC (Ser-19) content in the blastoderm of control embryos, nrz morphants, and embryos treated with increasing amounts of thapsigargin. (D) Effect of ROCK inhibitor Y26732 (50 μM) and MLCK inhibitor ML7 (20 μM) on the mortality of nrz morphants. Mortality of ML7-treated embryos 7 hpf results in blastomere detachment due to the lack of actin-myosin ring formation. Representative results from three independent experiments are shown. See also Figure S5. EXPRESSION / LABELING:
|
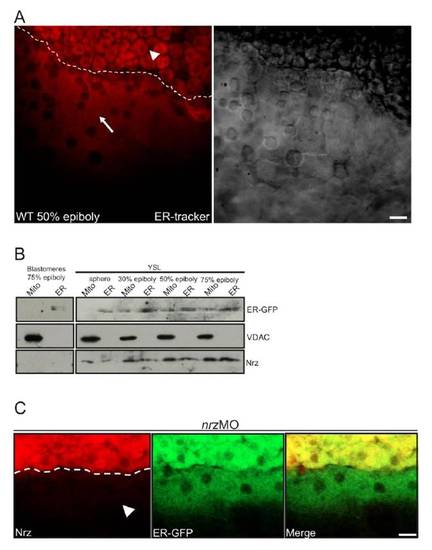
Endoplasmic reticulum detection and Nrz localization in the yolk syncitial layer (A) Confocal section of ER-trackerTM injected embryos at the 50% epiboly stage (left panel) in the margin region, between blastomeres (white arrowhead) and the YSL which is characterized by an intense ER-trackerTM red staining (white arrow). Unlabelled YSL nuclei appear as black dots. The corresponding bright field image is shown (right panel). (B) Subcellular fractionation of YSL mitochondria and YSL endoplasmic reticulum of ER-GFP-expressing embryos at sphere, 30%, 50% and 75% epiboly. Nrz is detected both in the ER fraction (ER) and the mitochondrial fraction (Mito). Subcellular fractionation of blastomeres at 75% epiboly shows absence of Nrz in both organelles (left lanes). VDAC and GFP antibodies were used as mitochondrial marker and ER marker respectively. (C) Confocal microscopy analysis of nrzMO injected embryo (nrz knock down). Detection of ER-GFP (green, middle panel) and endogenous Nrz protein (red, left panel) in the YSL of nrz knock down embryo at 50% epiboly stage. Nrz staining is absent in the YSL of nrz knock down embryos (white arrowhead). Scale bar: 20μm. |
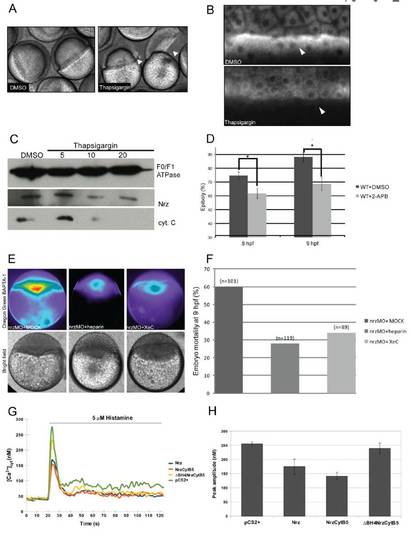
Implication of calcium signaling from the ER in nrz morphants phenotype (A)Thapsigargin injected embryos (5μM) showing margin constriction and blastomere detachment (black arrowheads, right panel), as compared to DMSO-injected controls (left panel). (B) Mitotracker™ labeling of YSL mitochondria showing the dramatic decrease of the ΔΨm of thapsigargin-treated embryos, compared to control embryos. (C) Immunoblot analyses. Detection of cytochrome C in YSL mitochondria isolated from embryos treated with increasing doses of Thapsigargin (μM) (bottom panel). The same western blot was probed with anti-Nrz (middle panel) and anti-F0/F1 ATPase (top panel, loading control) antibodies. (D) Histogram showing the effect of 2-APB treatement on epiboly progression (n : number of injected embryos); control embryos were treated with DMSO . (E) False color images of zebrafish embryos injected at 1-cell stage with nrzMO and Oregon Green BAPTA-1 AM, and re-injected at 512-cells stage with MOCK, heparin (400 g/mL) or Xestospongin C (20μM). (F) Embryo mortality measured at 9hpf. Number of injected embryos is shown (n). (G) Representative response of Fura-2 loaded HeLa cells either transiently expressing Nrz, NrzCytB5, ΔBH4NrzCytB5 or transfected with empty vector (pCS2+). Cells were stimulated with 5 μM histamine, an IP3-generating agonist (Peppiatt et al., 2003) during the indicated time (horizontal bar), and the kinetics of the subsequently Ca2+ release was measured by fluorescence as described in supplementary materials and methods. Representative data from 3 independent experiments. (H) Quantification of the histamine-induced Ca2+ peak. Means of 3 independent experiments, error bars are shown. |

Effect of nrz knock down on cytoskeleton organization in the YSL (A) Immunoblot showing the content of monomeric tubulin (supernatant) and polymerized microtubules (pellet) obtained by subcellular fractionation of zebrafish embryo lysates. (B) Densitometry measurement showing the percentage of monomeric tubulin expressed as a percentage of total tubulin in each fraction. (C) Alpha tubulin staining showing the effect of nrz silencing on microtubule organization in the yolk cell. Control embryos exhibit a dense microtubule network in the yolk cell (white arrowheads); in nrz morphants this network is severely altered. Embryos treated with Nocodazole (6.5 μM) show a similar phenotype. In contrast, incubation of nrz morphants with Taxol (50 μM) restores the yolk cell microtubule network. Scale bar: 50μm. (D) Immunoblot analysis of the actin content in blastomeres and in the yolk cell of control embryos and nrz morphants. Yolk cell proteins were separated from the blastomeres and yolk cortical actin was immunoprecipitated. Lefts panels: whole protein extracts from blastomeres; right panels: immunoprecipitated cortical actin (IP) from yolk homogenates. Alpha tubulin was used for calibration. The intensity of the actin band appeared to be slightly reduced in nrz morphants, suggesting that some proteolytic cleavage may actually have occurred in nrz morphants; however this partial degradation might not account entirely for the dramatic disappearance of cortical F-actin cables in the yolk cell. |
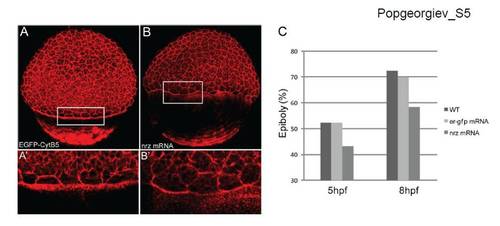
Effect of Nrz overexpression on epiboly progression. (A) Confocal microscopy analysis of phalloidin labelled embryos. Nrz over-expression leads to the inhibition of F-actin ring formation. Embryos expressing ER-GFP were used as controls. (B) Histogram showing the effect of Nrz over-expression on epiboly progression : Nrz slows down epiboly, ER-GFP having no effect ; mock injected embryos (WT) are used as controls. |
Reprinted from Developmental Cell, 20(5), Popgeorgiev, N., Bonneau, B., Ferri, K.F., Prudent, J., Thibaut, J., and Gillet, G., The Apoptotic Regulator Nrz Controls Cytoskeletal Dynamics via the Regulation of Ca(2)+ Trafficking in the Zebrafish Blastula, 663-676, Copyright (2011) with permission from Elsevier. Full text @ Dev. Cell