
- Title
-
Expression of the zebrafish genome during embryogenesis (NIH R01 RR15402)
- Authors
- Thisse, B., Pflumio, S., Fürthauer, M., Loppin, B., Heyer, V., Degrave, A., Woehl, R., Lux, A., Steffan, T., Charbonnier, X.Q. and Thisse, C.
- Source
- Submitted By
- Degrave, Agnes, Thisse, Bernard, Thisse, Christine (Citing this work)
- Protocol
- Thisse in situ hybridization protocol
- Probe
- cb735 Quality:
- Supplier
-
Supplier: Zebrafish International Resource Center (ZIRC) (order this)
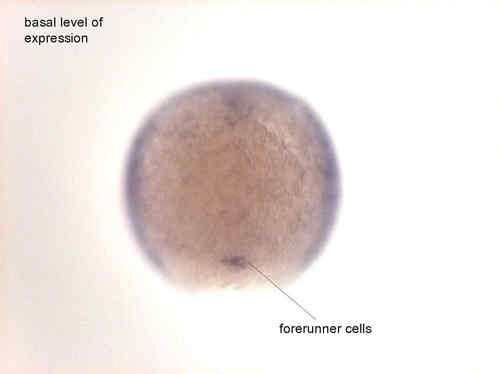
Basal level of expression. More staining in forerunner cells EXPRESSION / LABELING:
|
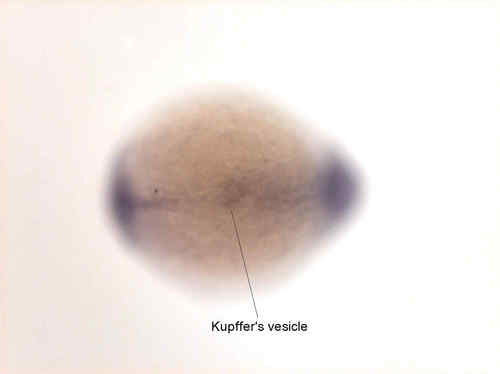
weak expression in Kupffer’s vesicle EXPRESSION / LABELING:
|


Fig. 3 expressed in pronephric ducts, otic vesicle, ventral posterior spinal cord EXPRESSION / LABELING:
|


Fig. 4 Expressed in ventral posterior spinal cord, pronephric ducts and otic vesicle EXPRESSION / LABELING:
|

basal level of expression in the head, expression in pronephric ducts |
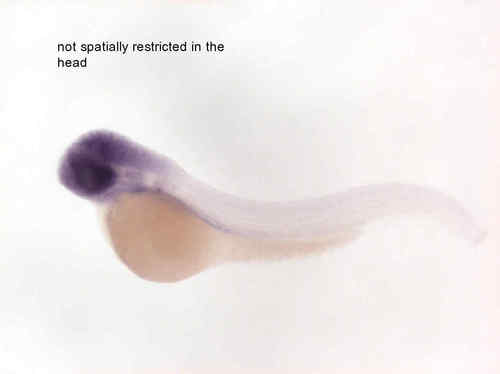
Basal level of expression in the head. |