
|
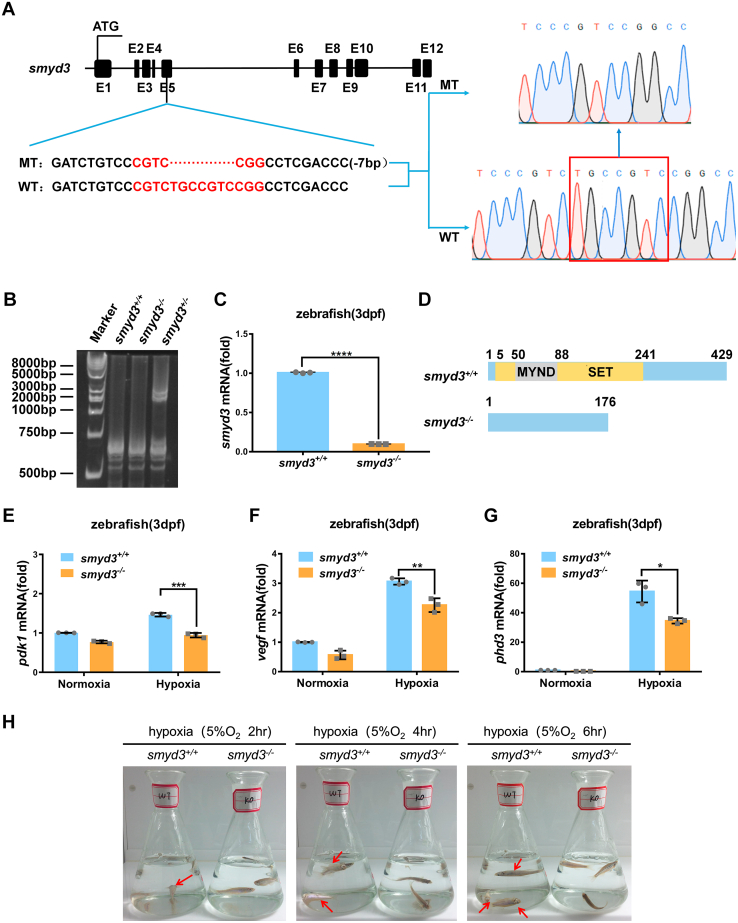
Figure 10
Disruption of smyd3 in zebrafish facilitates hypoxia tolerance. A, scheme of the sequence information in smyd3-null zebrafish. Seven–base pair nucleotides (5′-TGCCGTC-3′) were deleted in exon five of smyd3 in the mutant, resulting in a reading frame shift. B, verification of CRISPR/Cas9-mediated zebrafish smyd3 disruption by HMA (heteroduplex mobility assay). C, qPCR analysis of smyd3 mRNA in smyd3-deficient or wildtype zebrafish larvae (smyd3−/− or smyd3+/+) (3dpf). Data show mean ± SD; Student’s two-tailed t test. ∗∗∗∗p < 0.0001. Data from three independent experiments. D, the predicted protein products of smyd3 in the mutants (176 aa) and their wildtype (429 aa) siblings. aa, amino acids. E–G, qPCR analysis of pdk1 (E), vegf (F), and phd3 (G) mRNA in smyd3-deficient or wildtype zebrafish larvae (smyd3−/− or smyd3+/+) (3dpf) under normoxia (21% O2) or hypoxia (2% O2). Data show mean ± SD; Student’s two-tailed t test. ∗p < 0.05, ∗∗p < 0.01, ∗∗∗p < 0.001. Data from three independent experiments. H, the survival of wildtype (smyd3+/+; left flask) and smyd3-null (smyd3−/−; right flask) adult zebrafish (3mpf) after 2 h, 4 h, and 6 h under hypoxia (5% O2). Red arrows, dying zebrafish. qPCR, quantitative RT–PCR.