
Image
|
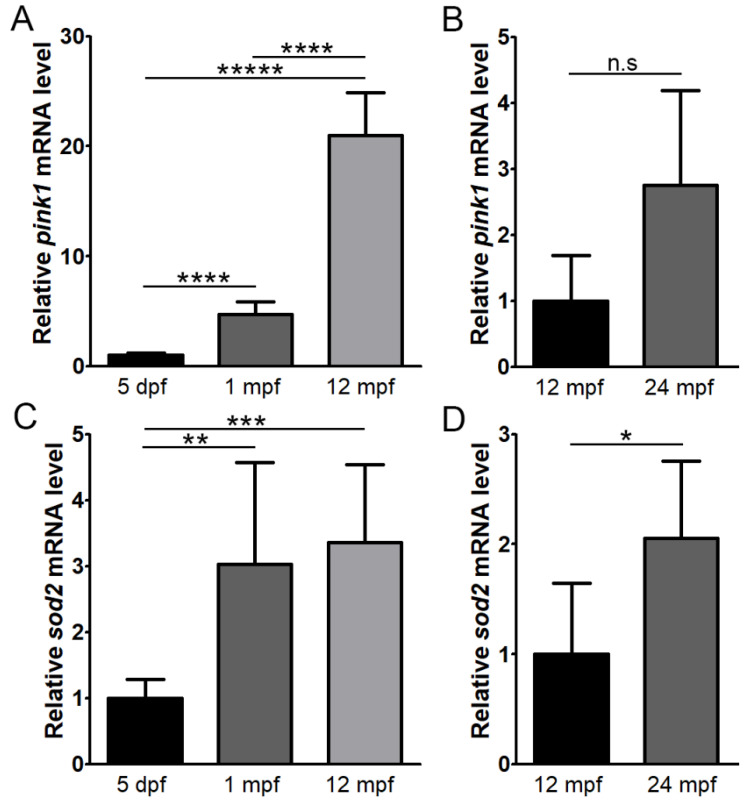
Figure Caption
Figure 7
Expression levels of pink1 and sod2 with age in the zebrafish retina. RT-qPCR was performed to assess expression of pink1 (A,B) and sod2 (C,D) at 5 days post-fertilisation (dpf), 1 month post-fertilisation (mpf), 12 mpf and 24 mpf (n = 5). * p < 0.05; ** p < 0.01; *** p < 0.001; **** p < 0.00001; ***** p < 0.0000001; n.s, not significant.
Figure Data
Acknowledgments
This image is the copyrighted work of the attributed author or publisher, and
ZFIN has permission only to display this image to its users.
Additional permissions should be obtained from the applicable author or publisher of the image.
Full text @ Cells