
|
Fig. 3
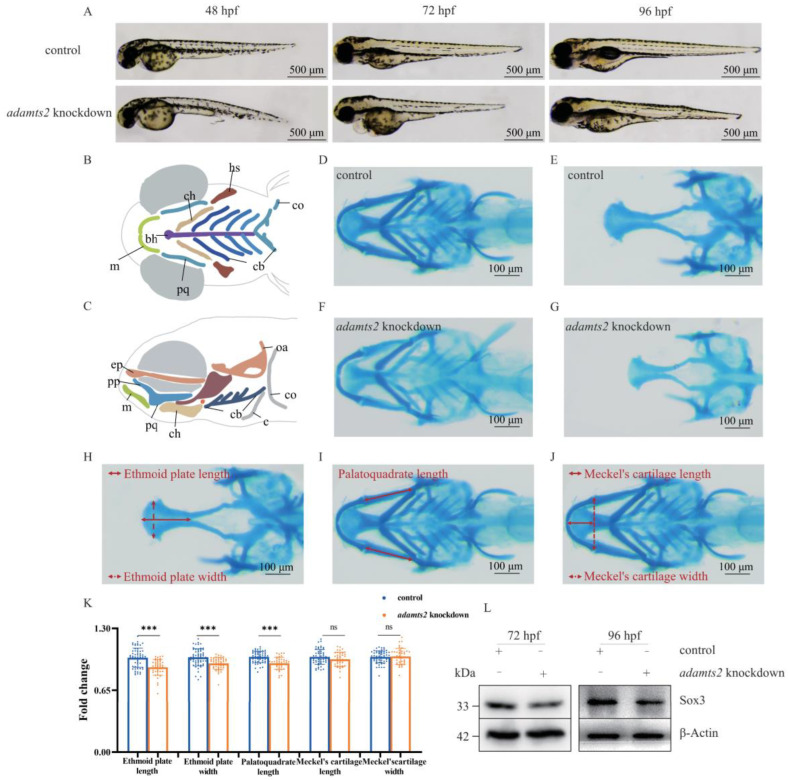
Phenotype in adamts2-knockdown zebrafish. (A) Zebrafish larvae were imaged in lateral positions with transmitted light at 48 hpf, 72 hpf, and 96 hpf. (B,C) Schematic diagram of zebrafish craniofacial structure from ventral view and lateral view: (bh) basihyal; (ch) ceratohyal; (co) coracoids of pectoral girdle; (cb) ceratobranchial; (c) cleithrum; (ep) ethmoid plate; (hs) hyosymplectic; (m) Meckel’s cartilage; (oa) occipital arch; (pp) pterygoid process of the palatoquadrate; (pq) palatoquadrate. (D,E) Control and (F,G) adamts2-knockdown zebrafish at 144 hpf were stained with Alcian blue to observe craniofacial cartilage structures from ventral and dorsal view. The red double arrow represents the measurement method of related indicators. (H) Ethmoid plate length and width; (I) palatoquadrate length; (J) Meckel’s cartilage length and width. (K) Scatter histogram showing change of palatoquadrate length, as well as length and width with respect to Meckel’s cartilage and ethmoid plate in control and adamts2-knockdown zebrafish. (L) Comparison of the sox3 protein expression levels in control crispant and adamts2 crispant zebrafish at 72 hpf and 96 hpf. n = 3 independent replicates for all experiments. For (D–K): control crispant n = 56 embryos, adamts2 crispant n = 41 embryos. Error bar represents the SD. ns, no significance, *** p < 0.001. Scale bars: 500 μm (A), 100 μm (D–J).