
Image
|
Figure Caption
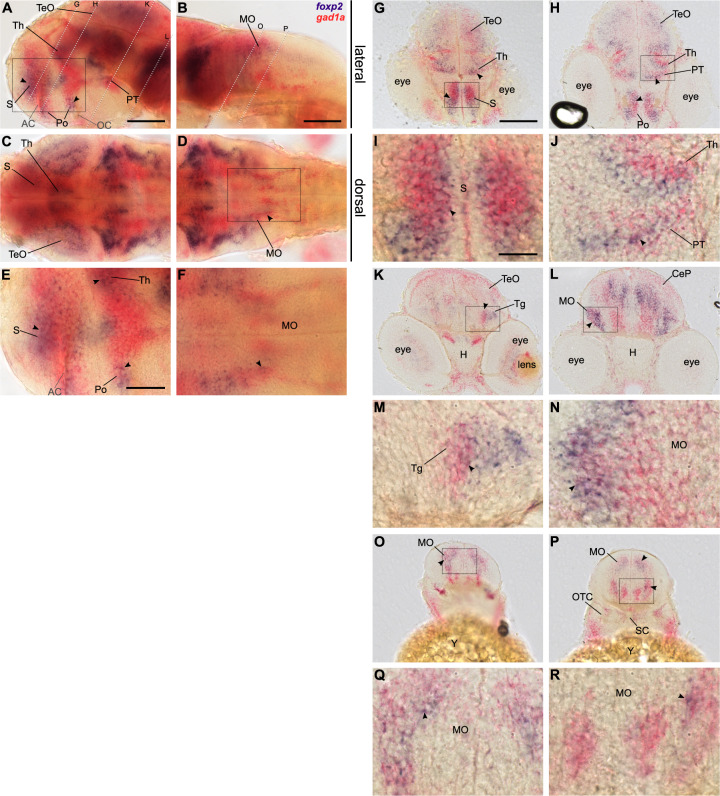
Fig. 3
Double labelling of foxp2 (blue) and gad1a (red) expression in 48 hpf old wildtype embryos using two-colour RNA ISH. Lateral (A, B, E) and dorsal (C, D, F) overview of embryonic CNS with anterior to the left. E, F Magnifications of boxed areas in A and D. Dashed lines indicate cutting sites for cross-sections displayed in G–R. I, J, M, N, Q, R magnifications of boxed areas in G, H, K, L, O, P, respectively. Arrows indicate sites of co-localisation. Abbreviations are listed in Table S4. Scale bars: 100 µm (overview), 50 µm (magnified images).
Figure Data
Acknowledgments
This image is the copyrighted work of the attributed author or publisher, and
ZFIN has permission only to display this image to its users.
Additional permissions should be obtained from the applicable author or publisher of the image.
Full text @ Transl Psychiatry