
Image
|
Figure Caption
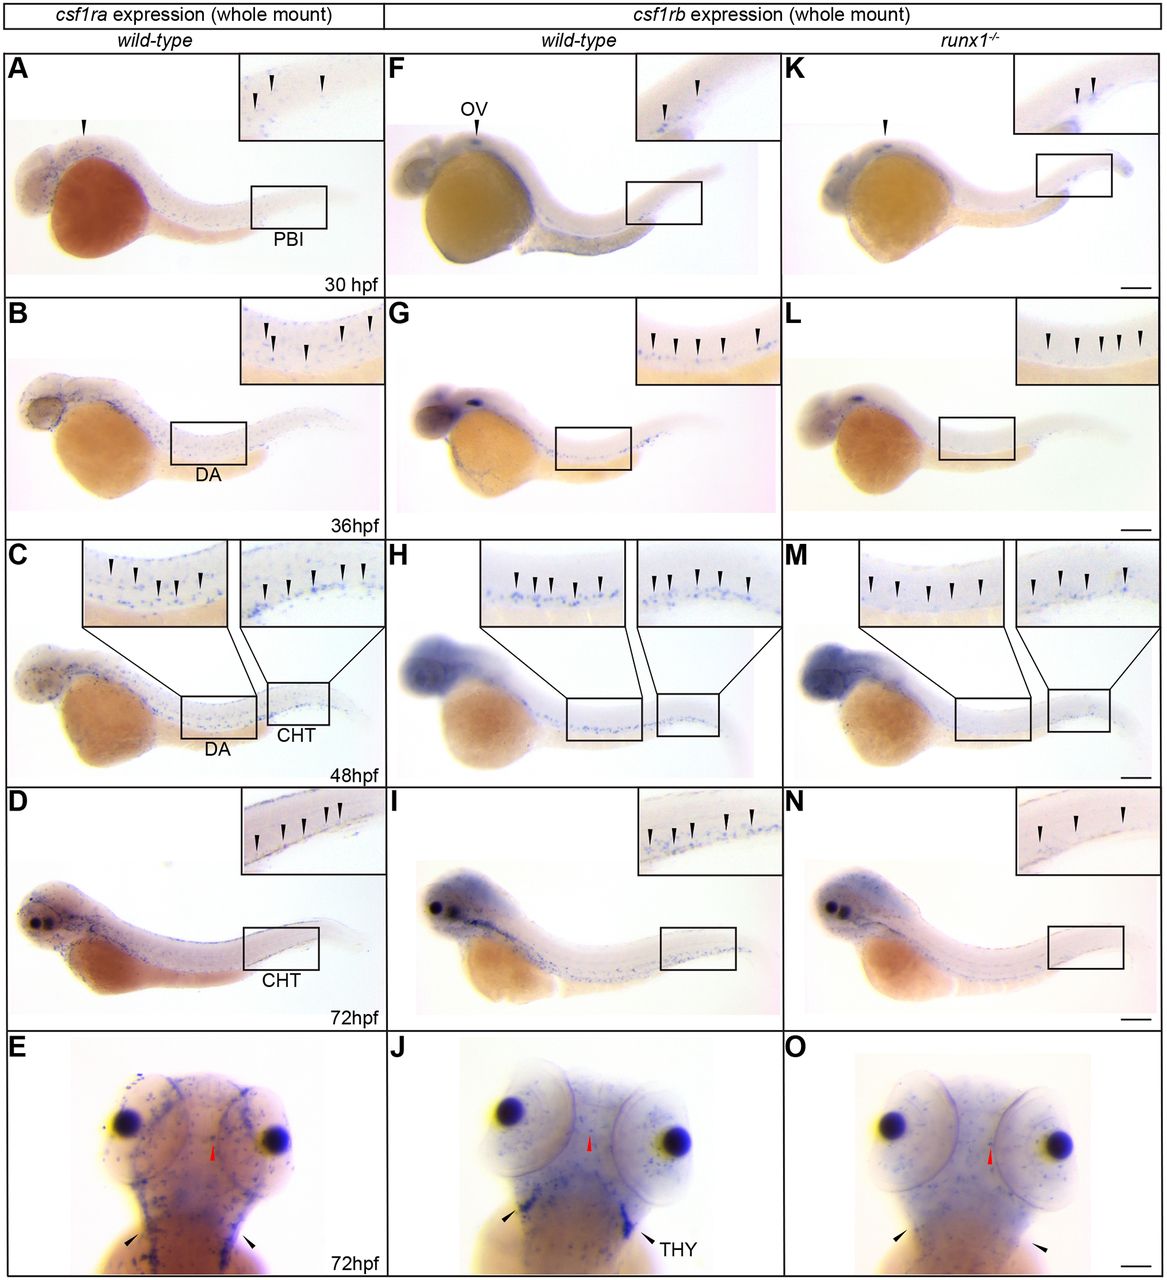
Fig. 1 Csf1ra and csf1rb paralogs have non-overlapping distribution during early development, except for microglia. (A-O) WISH expression profiles of csf1ra (A-E) and csf1rb (F-J) in wild-type, and csf1rb in runx1−/− (K-O) embryos, at the indicated stages. All lateral views, except for E, J and O, shown in dorsal view. Black arrowheads indicate cells in each region. Red arrowheads indicate microglia. Insets show magnification of boxed areas. THY, thymus. Scale bars: 200 µm (30 and 36 hpf); 180 µm (48 hpf); 150 µm (72 hpf).
Figure Data
Acknowledgments
This image is the copyrighted work of the attributed author or publisher, and
ZFIN has permission only to display this image to its users.
Additional permissions should be obtained from the applicable author or publisher of the image.
Full text @ Development