
|
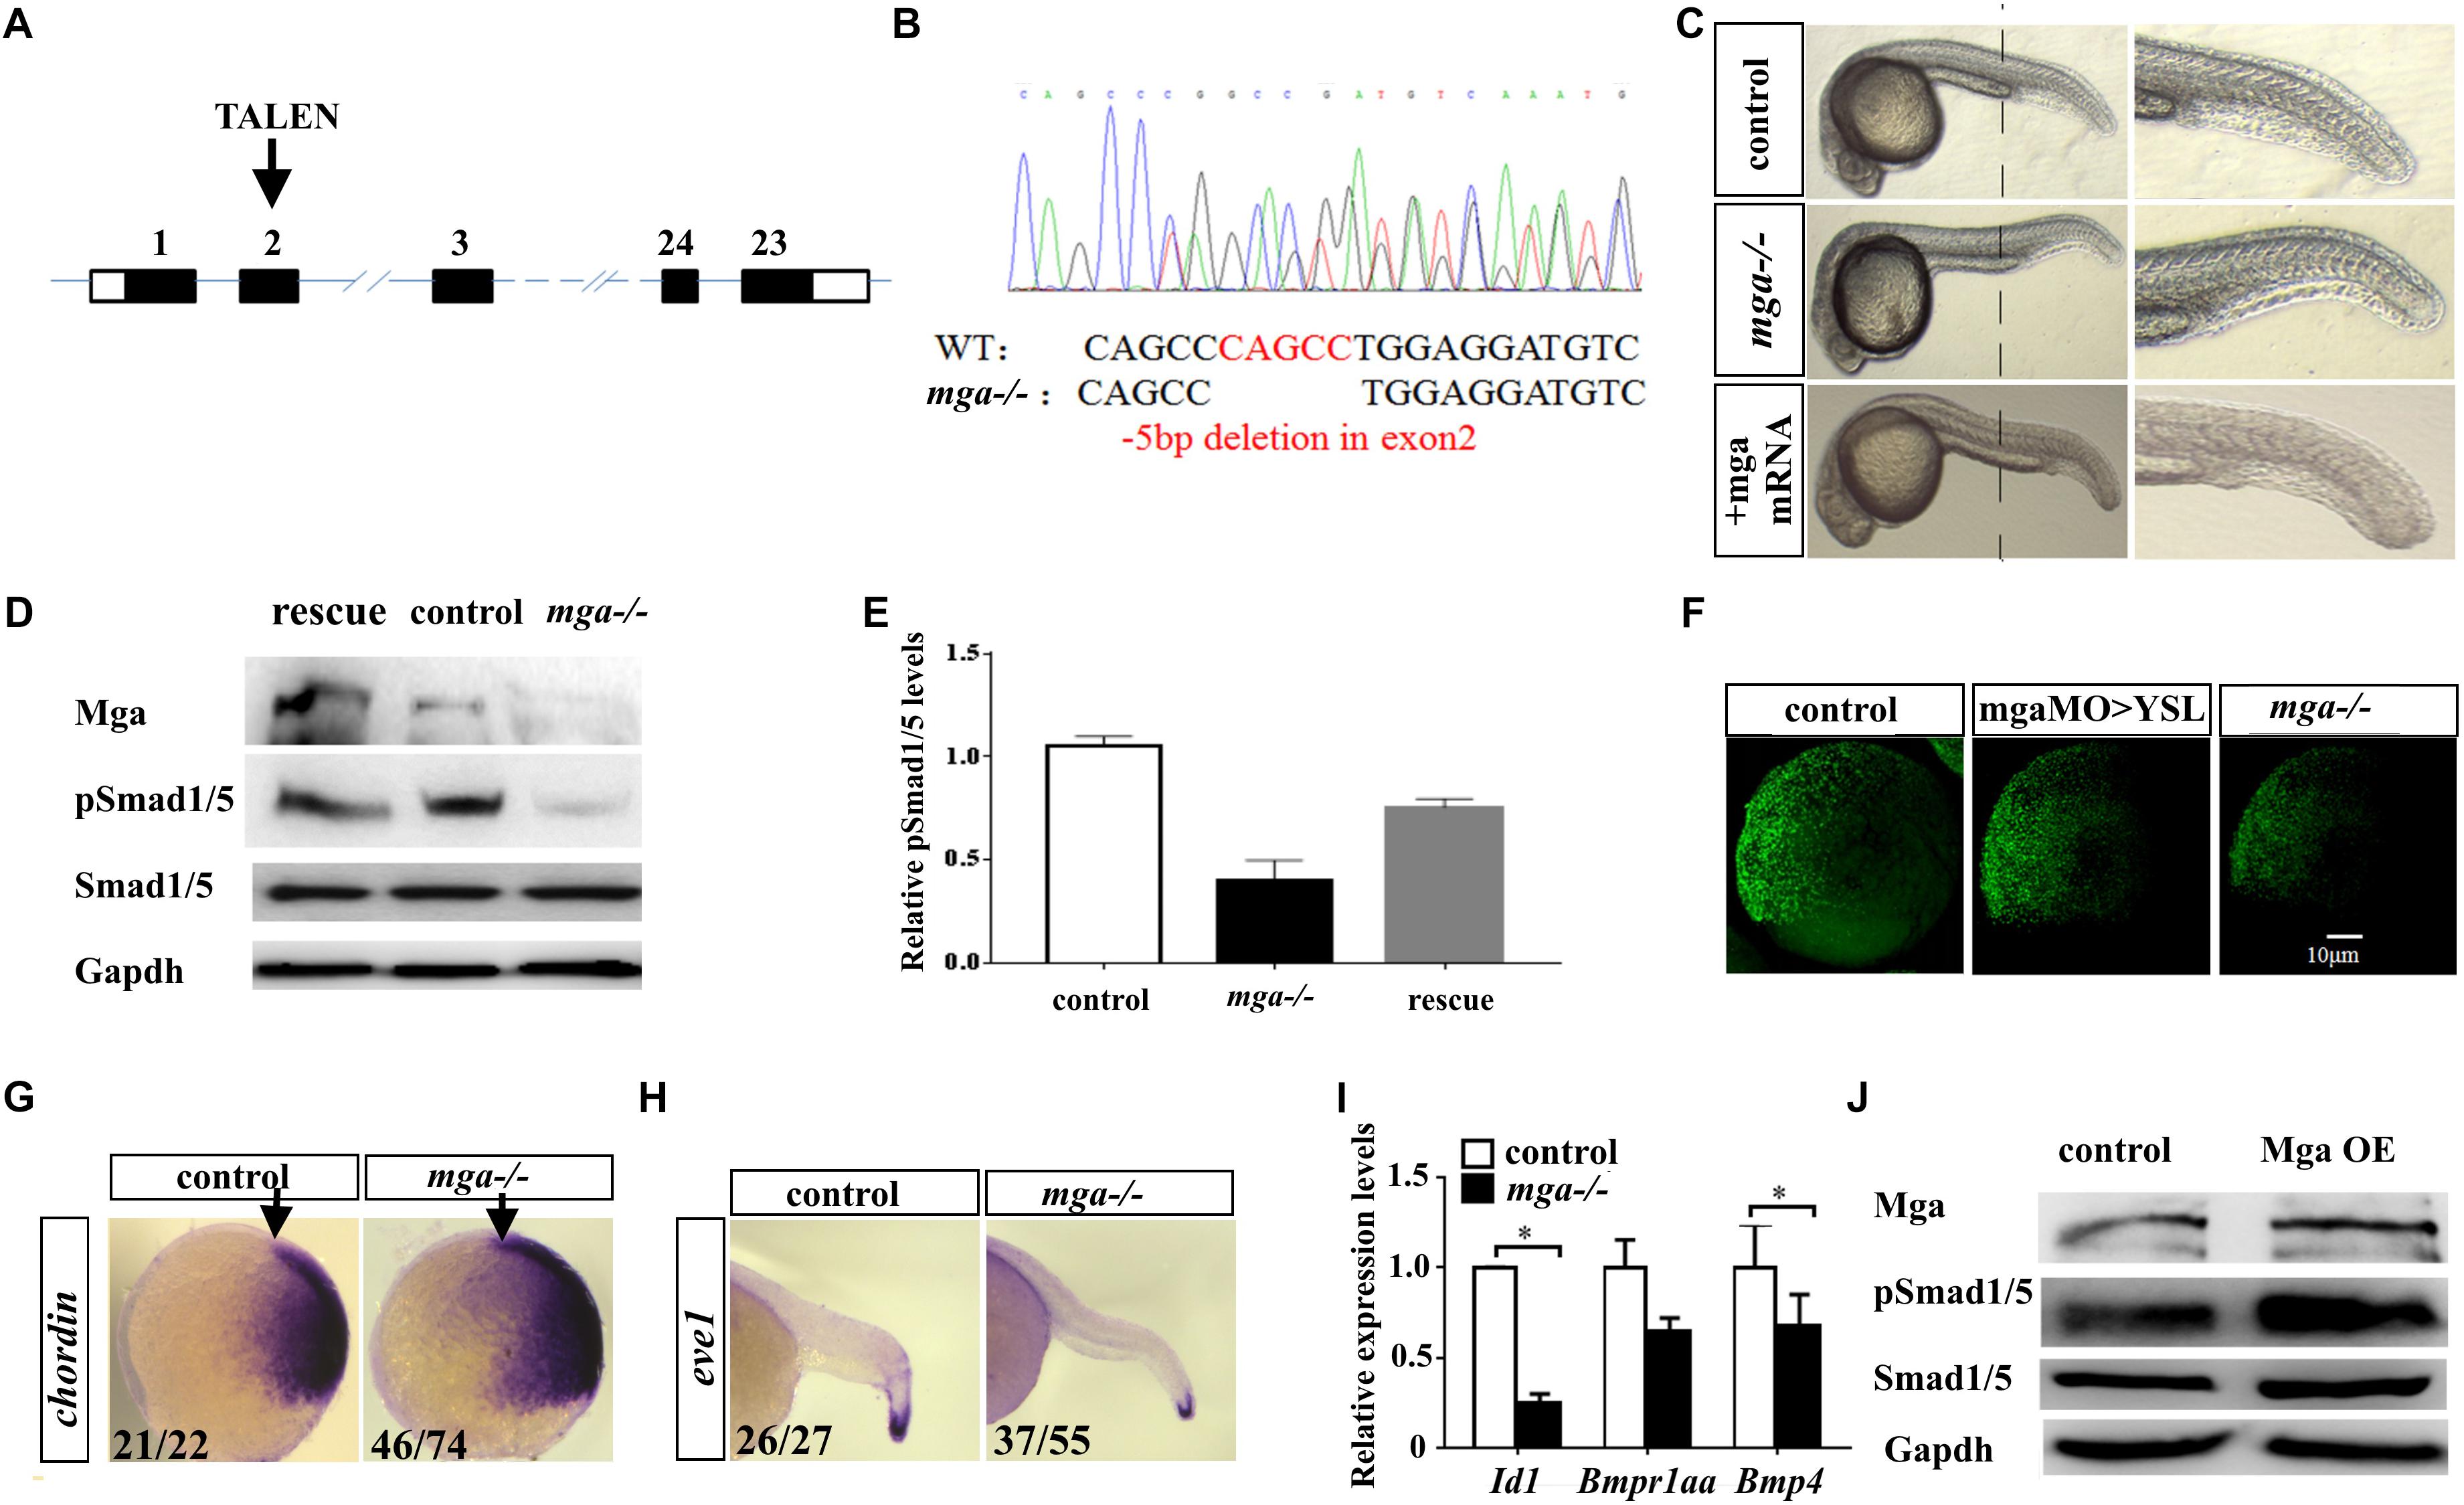
Fig. 1
Mga mutant embryos exhibited mild dorsalized phenotype. (A) Schematic representation of the zebrafish mga gene, depicting the location of the TALEN targeting site. (B) Sequences around the TALEN targeting site, showing the TALEN-induced 5-bp deletion in mga (in red). (C) Phenotypes of 1 dpf wild type, mga mutant, and mga mutant embryos injected with 50 pg mga mRNA at one-cell-stage. The reduction of ventral tail fin was restored by injecting 50 pg mga mRNA into one-cell-stage of mga mutant embryos. Lateral view. (D) Immunoblot analysis of Mga and pSmad1/5 levels of lysates from 7 hpf control, mutant and mga mRNA restored embryos. (E) Quantification of pSmad1/5 levels of panel D based on three independent experiments. (F) pSmad1/5 gradient of wild type, mga > YSL morphants, and mga mutant embryos at 7 hpf. Dorsal to the right. (G) Chordin expression in mga mutant and control embryos at shield stage. Lateral view, and dorsal to the right. (H) eve1 expression in mga mutant and control embryos at 22 hpf. Lateral view, and dorsal to the right. (I) qRT-PCR transcript analysis of the indicated Bmp target genes in control and mga mutant embryos at 8 hpf. (J) Immunoblot analysis of pSmad1/5 levels of lysates from 8 hpf control and Mga overexpressing (OE) embryos. All experiments were performed in technical triplicate and are representative of multiple experiments. ∗p < 0.05.