
|
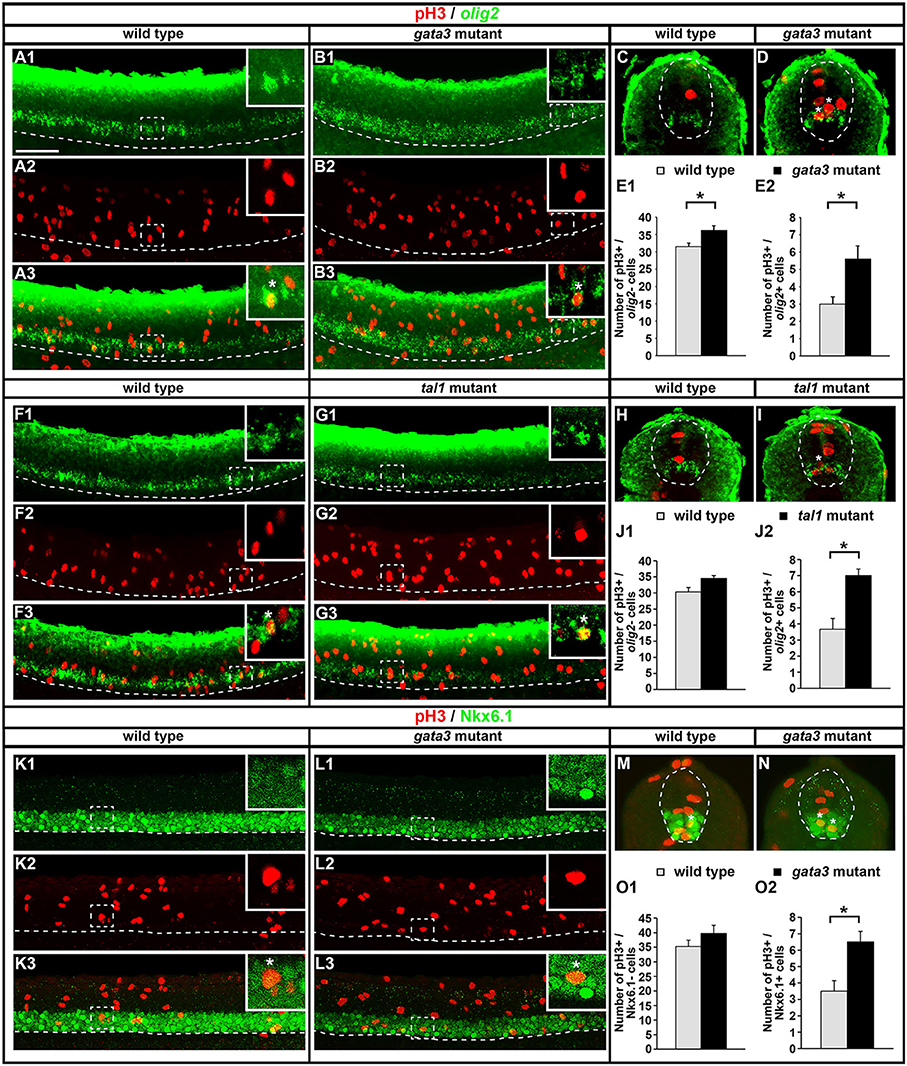
Fig. 13
Expression of pH3 and either olig2 or Nkx6.1 in tal1 and gata3 mutants. Lateral (A,B,F,G,K,L) and cross-sectional (C,D,H,I,M,N) views of pH3 (red) and either olig2 or Nkx6.1 (green) expression in WT embryos (A,C,F,H,K,M), gata3 mutants (B,D,L,N), or tal1 mutants (G,I) at 24 h. Dorsal, top; in lateral views, anterior, left. White boxes in top right hand corners of lateral views are single confocal plane magnified views of the area indicated with a white dotted box. White stars indicate double-labeled cells. White dashed lines indicate the ventral limit of the spinal cord (lateral views) or the boundary of the spinal cord (cross-sections). For lateral views, single channel and merged images are shown. Scale bar = 50 microns. Mean number of pH3-positive; olig2-negative cells (E1,J1) and pH3-positive; olig2-positive cells (E2,J2) adjacent to somites 6–10 in WT and mutant embryos. Mean number of pH3-positive; Nkx6.1-negative cells (O1) and pH3-positive; Nkx6.1-positive cells (O2) adjacent to somites 6–10 in WT and mutant embryos. All counts are an average of at least 3 embryos. Cell rows were assigned based on average cell diameters. Error bars indicate SEM. Statistically significant comparisons are indicated with brackets and stars. *P < 0.05. For P-values see Supplementary Table 6.