
|
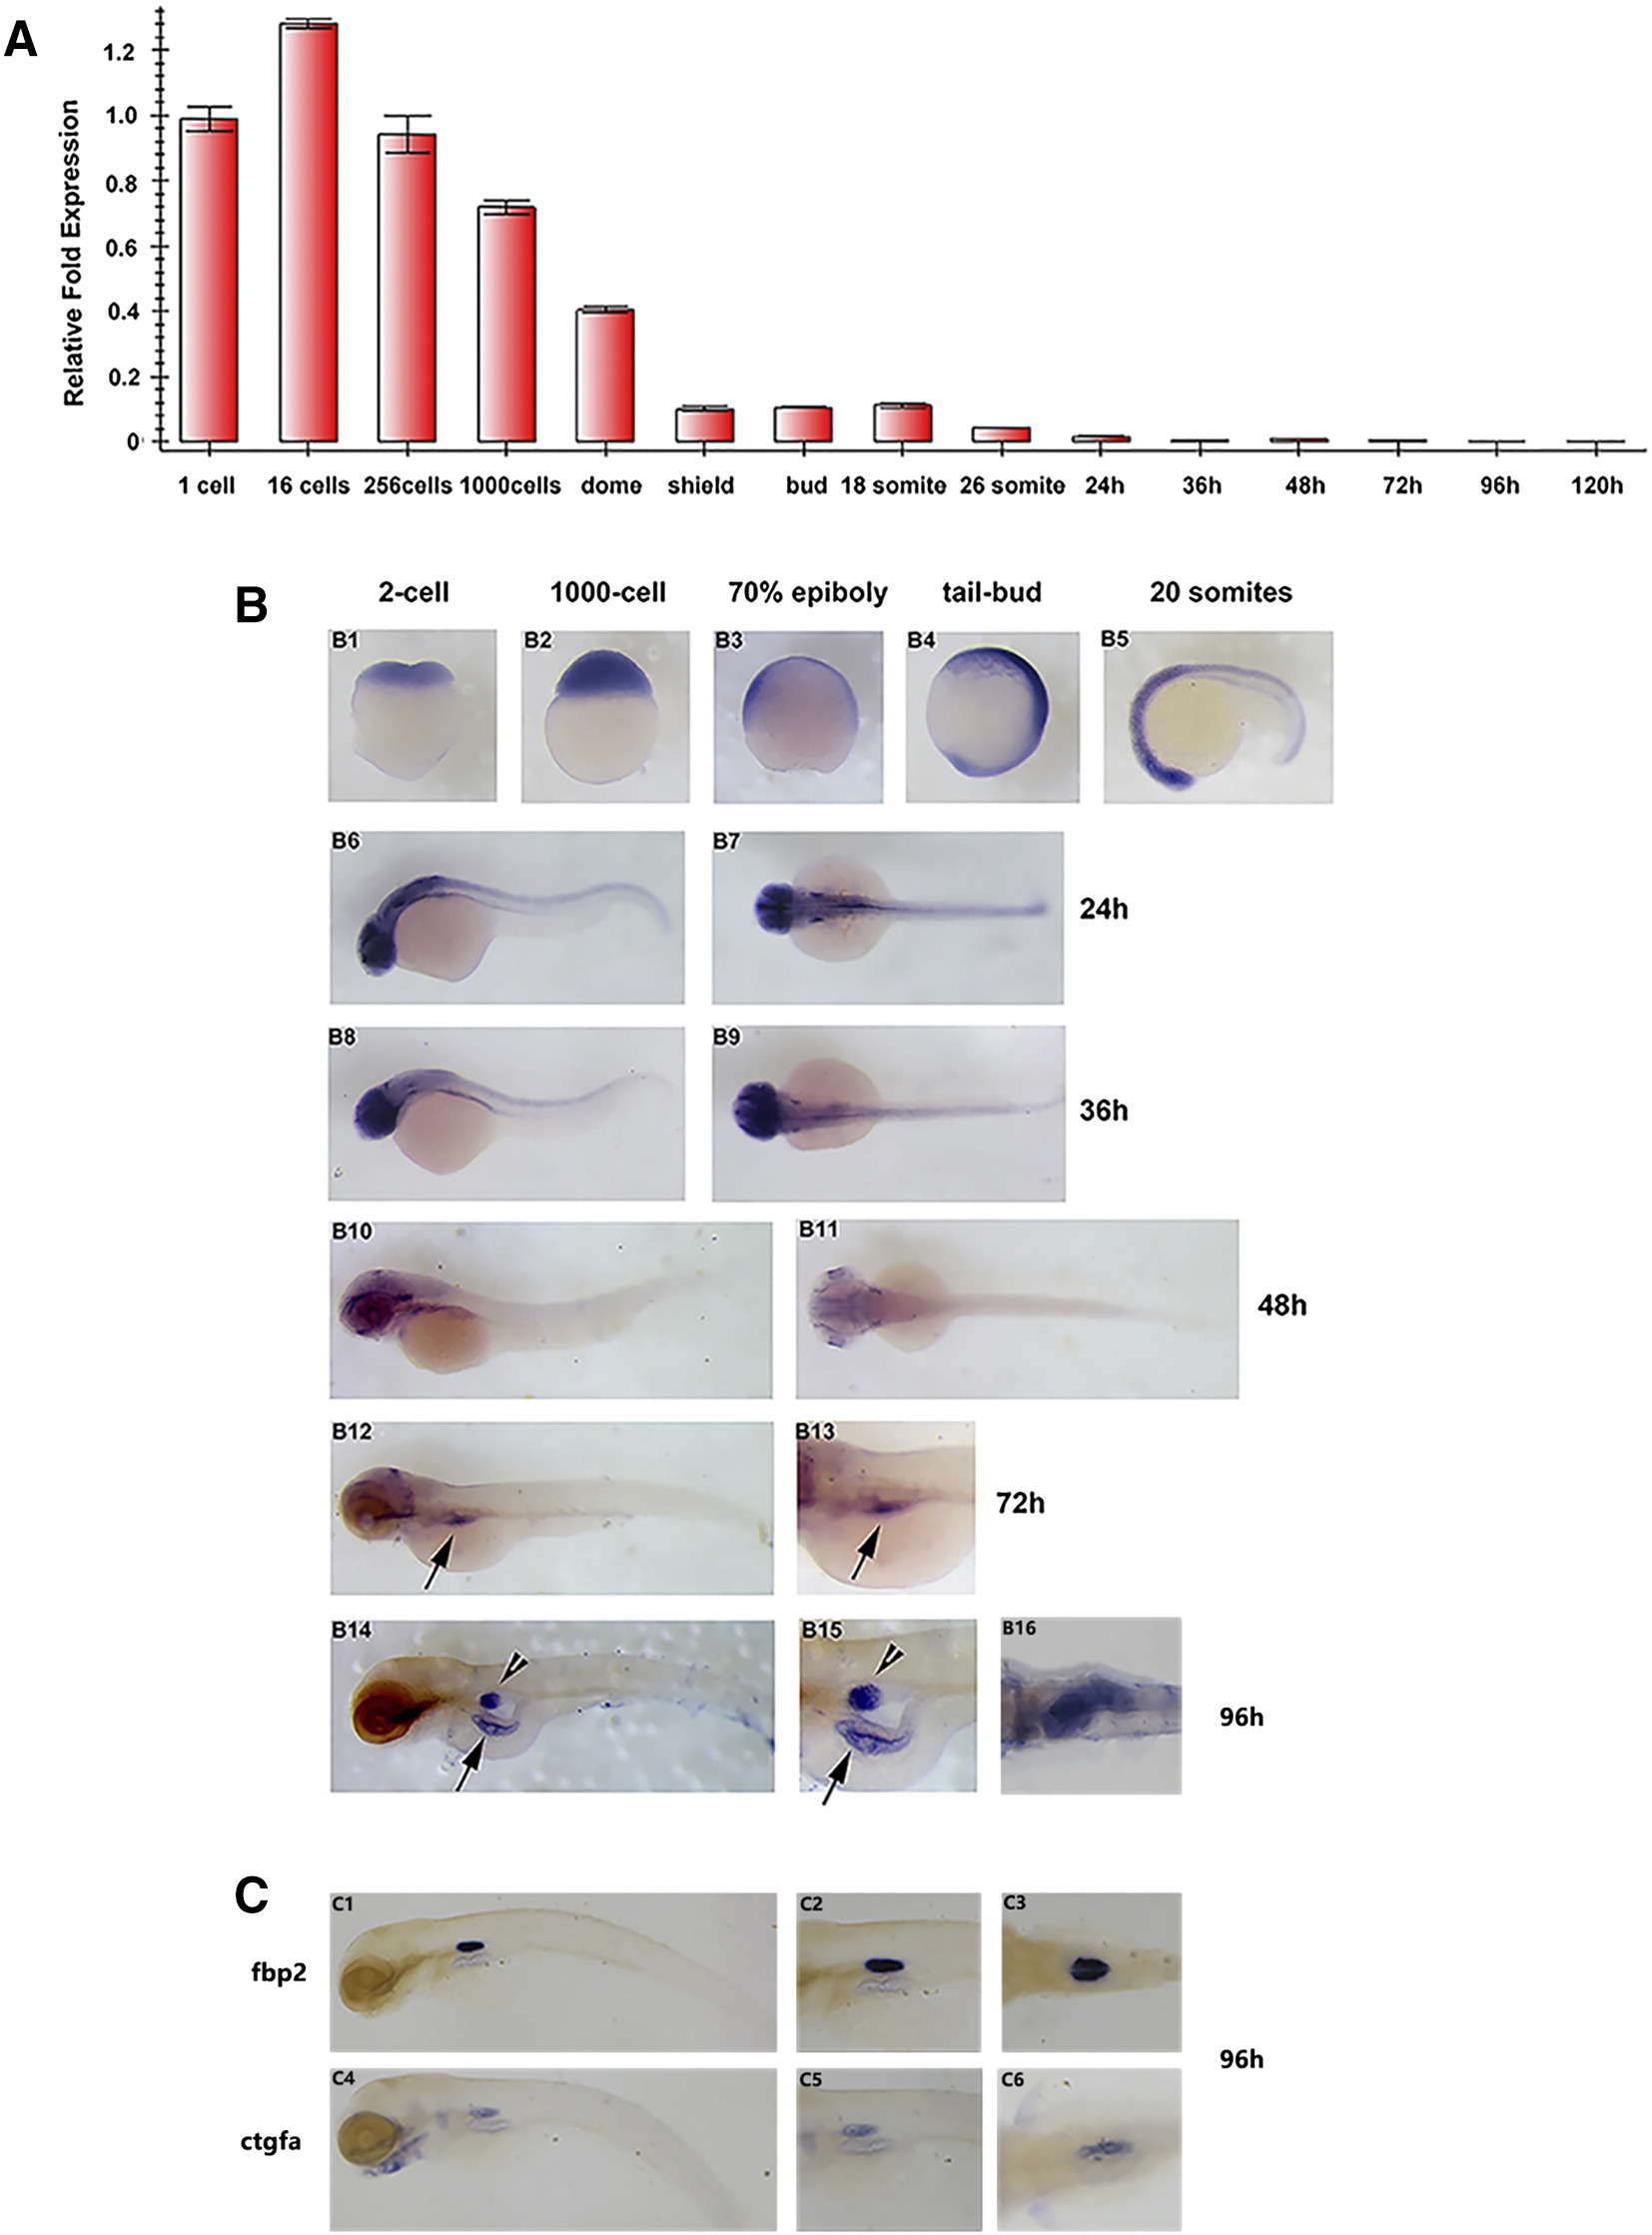
Fig. 4
whsc1 expression pattern during early embryonic development. (A) Quantitative PCR analysis of whsc1 mRNA levels in embryos at various developmental stages. Relative ratio (fold changes) obtained from 1-cell stage embryos was set to 1. (B) Whole mount in situ hybridization analysis of whsc1 mRNA expression pattern in embryos at various developmental stages. B1-B2 were lateral view; B3-B4 were lateral view with dorsal to the right; B7, B9, B11 and B16 were dorsal view with head to the left; the rest were lateral view with head to the left. Note that whsc1 was expressed specifically in the swim bladder and gut (B14–15). Arrowheads point to the bladder and arrows point to the gut. (C) WISH analysis of swim bladder markers fbp2 and ctgfa. C1–2 and C4–5 were shown in lateral view with head to the left; C3 and C6 were shown in dorsal view with head to the left.