
|
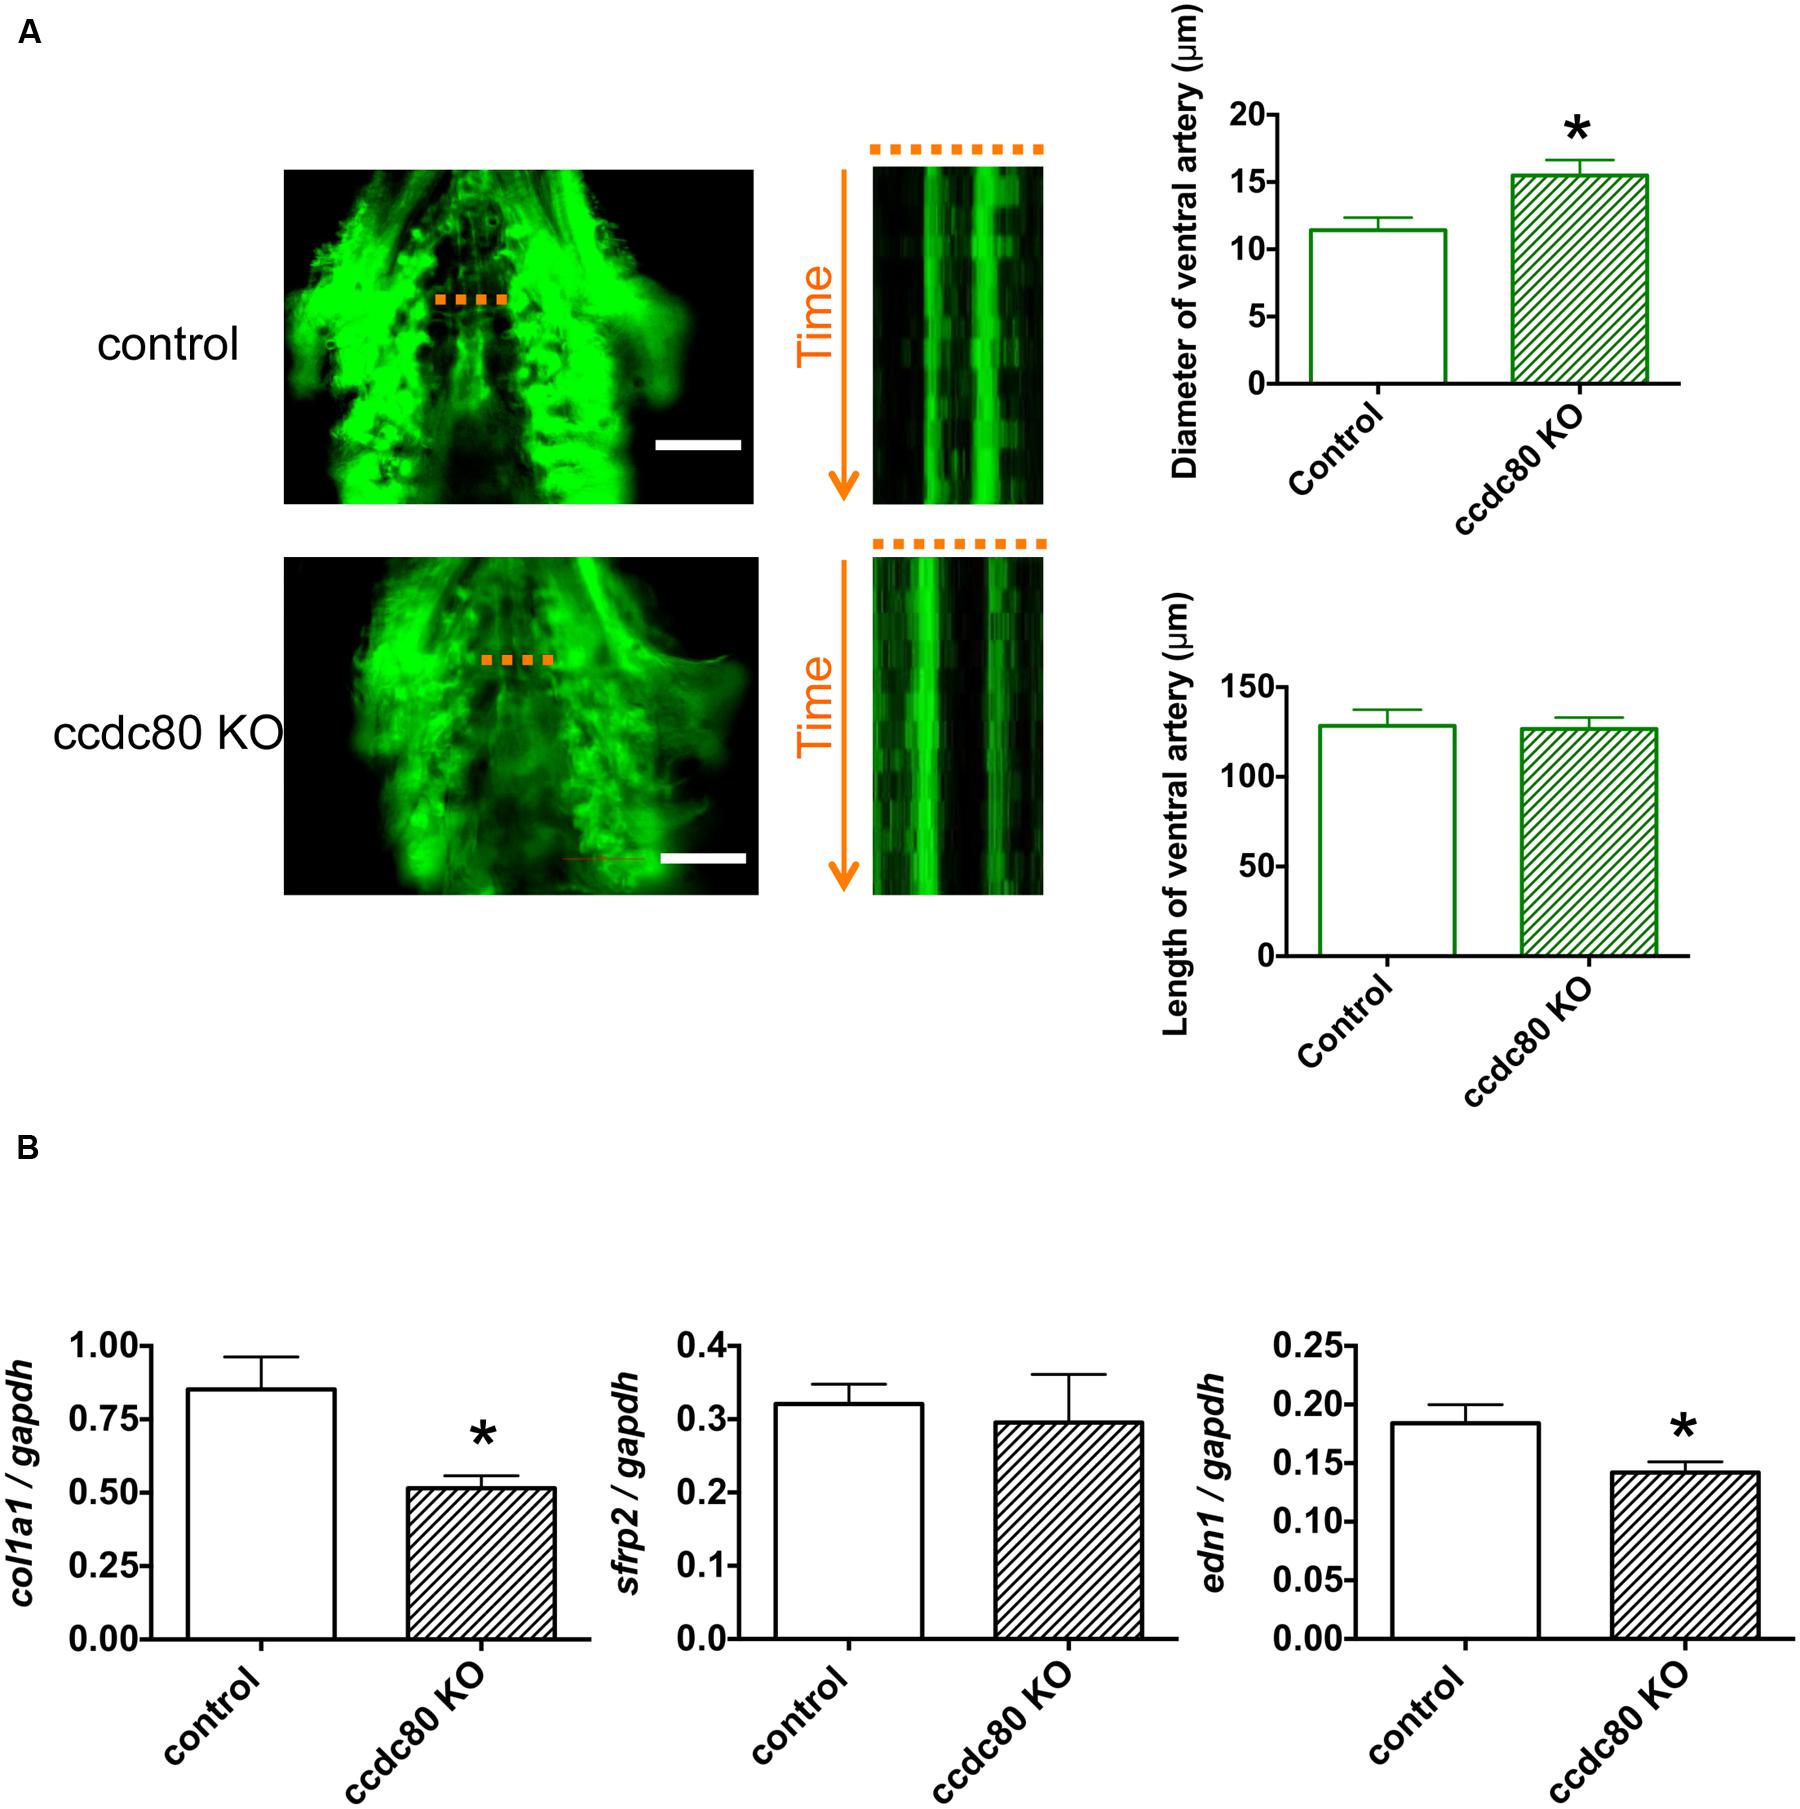
Fig. 4
Knockout of ccdc80 causes ventral artery dilation and decreases col1a1 and edn1 expression in zebrafish. (A) In vivo imaging of the ventral artery of control and ccdc80 knockout Tg (fli1:EGFP) zebrafish at 6 dpf. Zebrafish were placed on slides on their backs, and the ventral artery was imaged under a fluorescence microscope at 100 frames/s for 5 s. Image stack projections and time-lapse imaging traces at the level of the ventral artery (dotted lines) are shown. Bar, 100 µm. The ventral artery diameter of the ccdc80 knockout zebrafish was significantly larger than that of control, whereas the length of ventral artery was not significantly different between groups. The upper right bar graph shows quantification of ventral artery diameters measured using time-lapse imaging. The lower right bar graph shows quantification of ventral artery lengths. N = 6 or 9 for the control and ccdc80 knockout groups, respectively. *p < 0.05 vs. control. (B) qPCR analysis of col1a1, sfrp2, and edn1 mRNA levels in control and ccdc80 knockout zebrafish at 6 dpf. Expression of col1a1, sfrp2, and edn1 was normalized to that of gapdh. N = 8 per group. *p < 0.05 vs. control groups.