
|
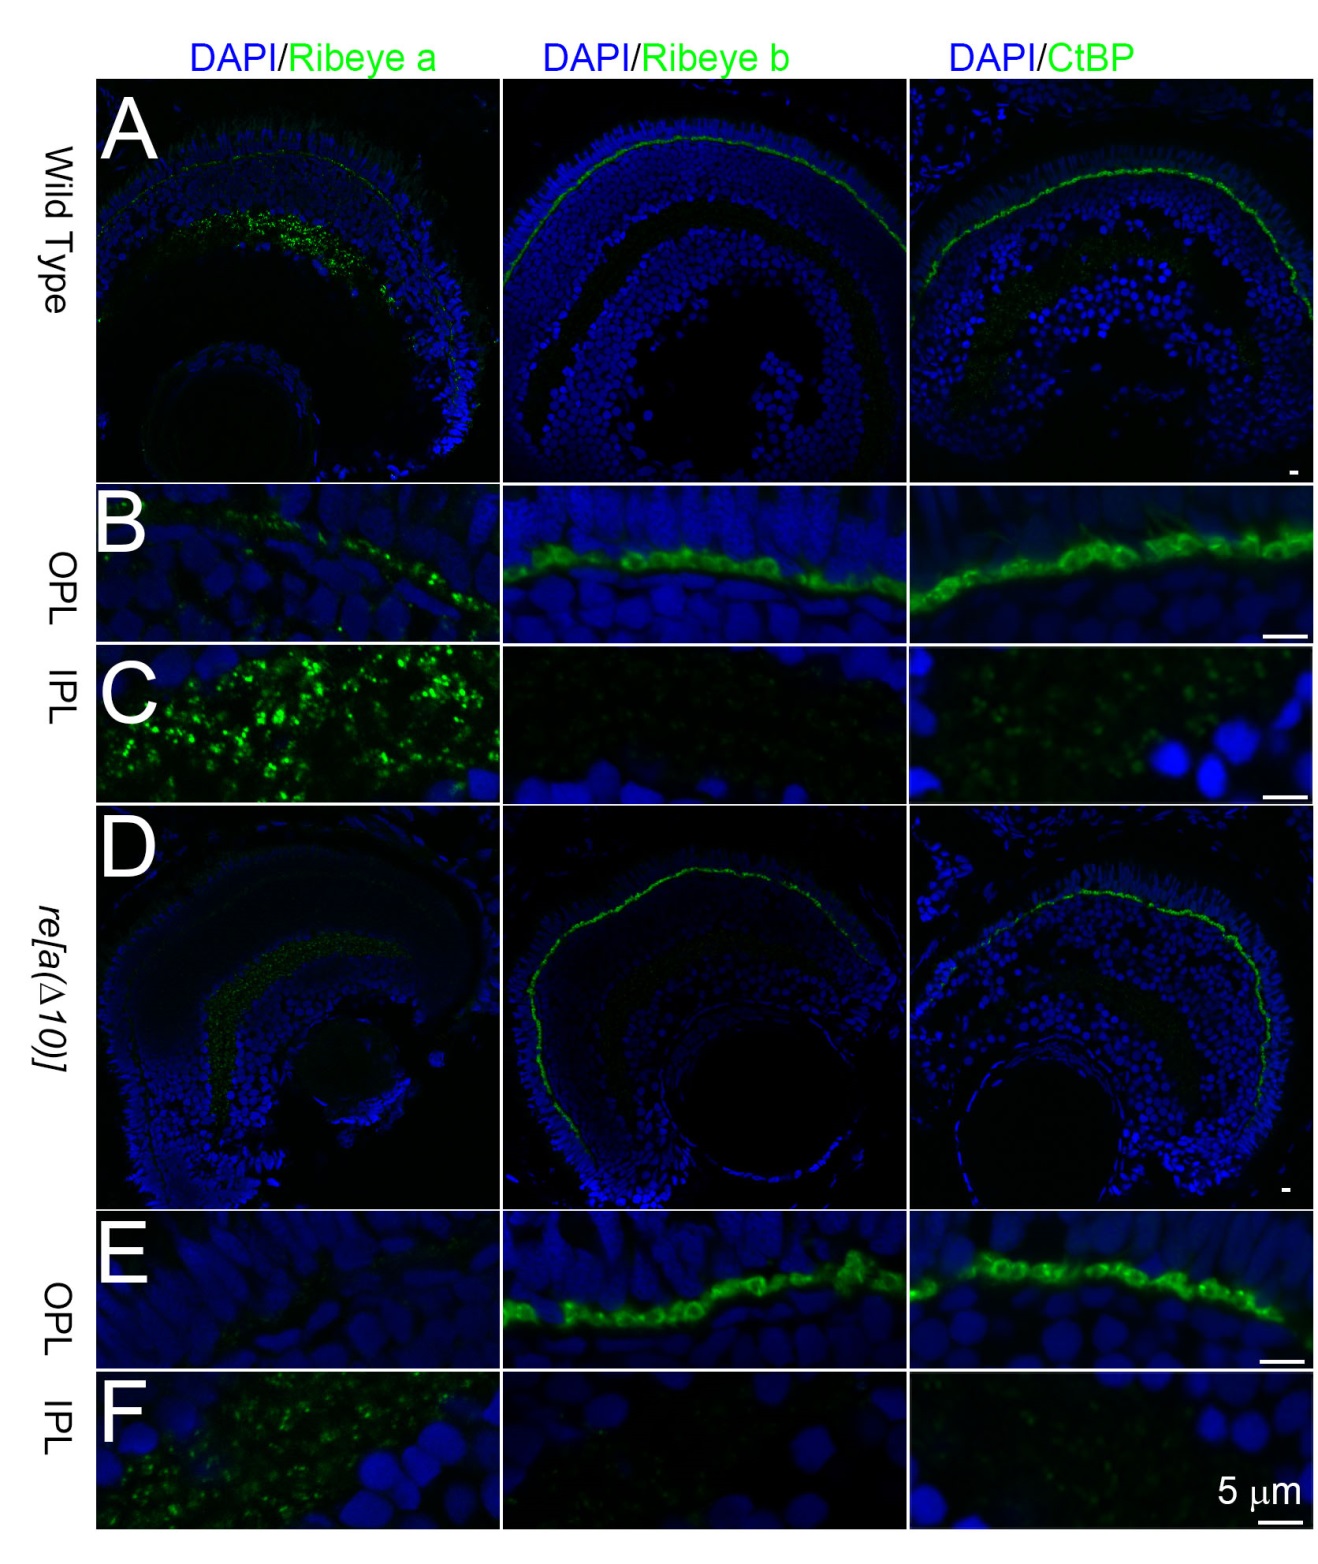
Fig. S2
Expression of Ribeye A, Ribeye B nor CtBP in 5dpf wt and ribeye a Δ10 retina. A, Confocal images of Ribeye A, Ribeye B, and CtBP staining (green) in 5dpf wt zebrafish retina. B, 3X magnification of outer plexiform layer staining in wt 5dpf zebrafish retina. C, 3X magnification of inner plexiform layer staining in wt 5dpf zebrafish retina. D, Confocal images of Ribeye A, Ribeye B, and CtBP staining (green) in 5dpf ribeye a Δ10 mutant fish retina. E, 3X amplification of outer plexiform layer staining in 5dpf ribeye a Δ10 mutant fish retina. Notice the dramatic reduction of Ribeye A staining in ribeye a Δ10 mutant fish. F, 3X magnification of inner plexiform layer staining in 5dpf ribeye a Δ10 mutant fish retina. DAPI (blue) stains nucleus. WT and mutant fish were taken under the same settings for the same antibody. Scale bar is 5 µm.