
Image
|
Figure Caption
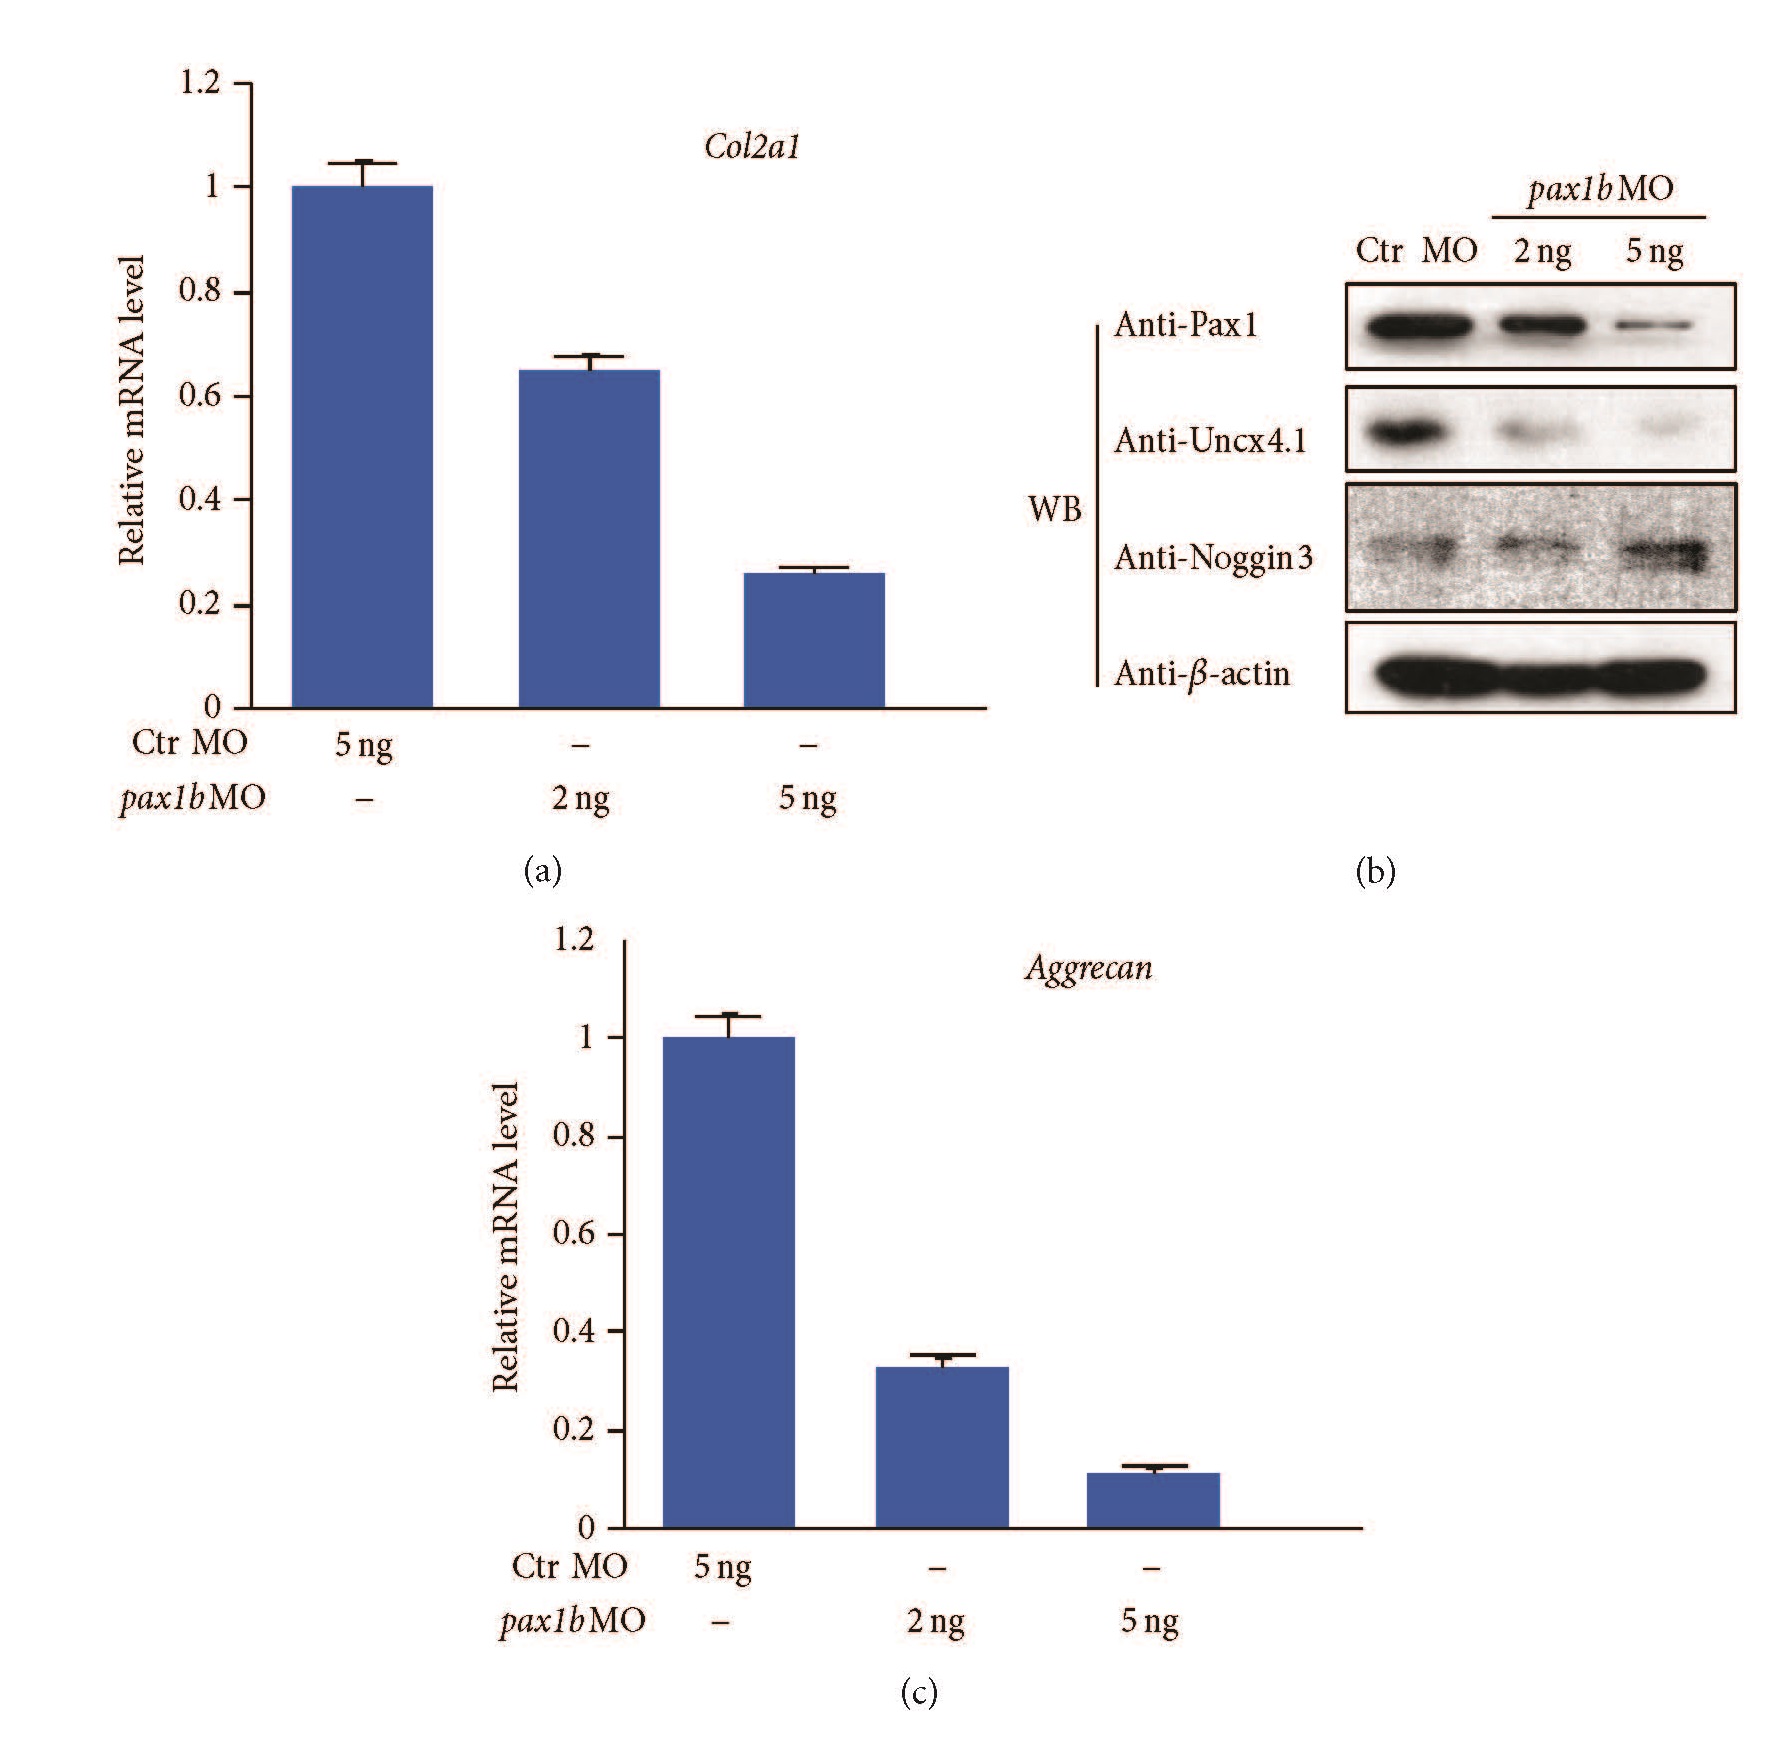
Fig. 4
Molecular mechanism of sclerotome development mediated by Pax1b. (a) The relative expression level of zebrafish collagen type II (col2a1) monitored by qPCR. (b) Sclerotome differentiation analyzed by molecular markers Uncx4.1 and Noggin3 by Western blot. (c) The relative expression level of zebrafish aggrecan monitored by qPCR. The fold change for each group was determined using the delta-delta Ct method. Quantified mRNA levels were normalized to β-actin and are presented relative to control embryos. 50 embryos at the 48 hpf stage were used in each group, performed in triplicate.
Figure Data
Acknowledgments
This image is the copyrighted work of the attributed author or publisher, and
ZFIN has permission only to display this image to its users.
Additional permissions should be obtained from the applicable author or publisher of the image.
Full text @ Biomed Res. Int.