
|
Fig. 3
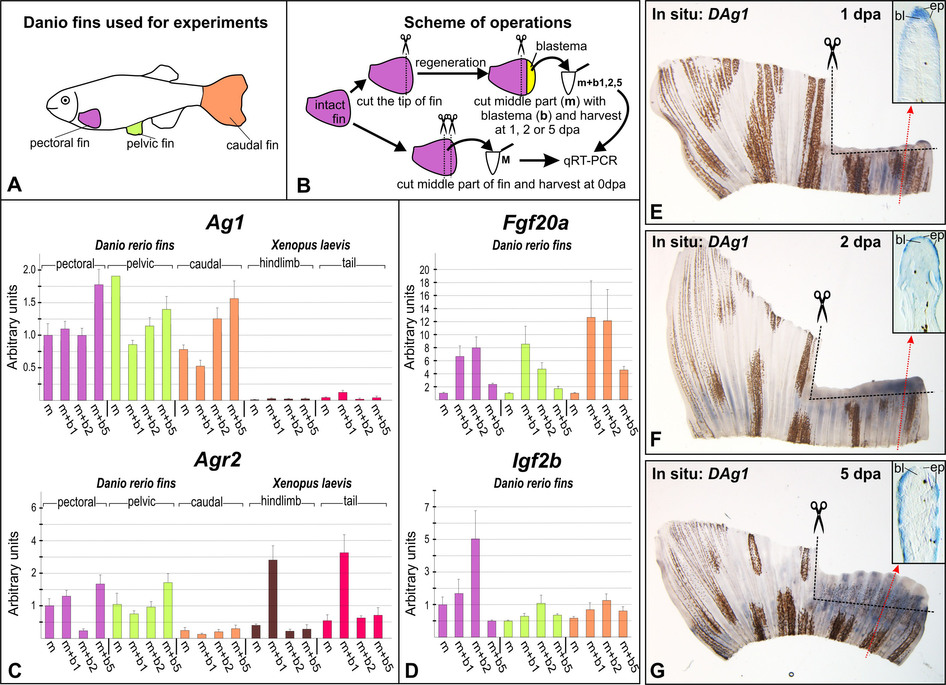
Analysis of Ag1, Agr2, Fgf20a and IGF2b expression in the regenerating fins.
(A and B). Schemes of experiments. Tissue pieces of hindlimbs and tails of stage 52 Xenopus laevis tadpoles were collected as was previously described5. Drawings for these figures were done by MBT and AGZ. (C and D). QRT-PCR analysis of Ag1 and Agr2 (C) and Fgf20a and Igf2b (D) expression in the intact and regenerating of fins of adult Danio rerio and in hindlimbs and tails of stage 52 Xenopus laevis tadpoles. All graphs represent means of triplicate experiments. Bars indicate standard deviations. The geometric mean of expression of Danio rerio and Xenopus laevis ornithine decarboxylase (ODC) and elongation factor 1alpa (EF-1alpha) was used for normalization of experimental values (see Materials and Methods for details). The value of normalized PCR signal in "m" sample taken from pectoral fin was taken as an arbitrary unit in each series. (E–G). In situ hybridization of regenerating caudal fins with the probe to DAg1 at 1, 2 and 5dpa. Photos on insets demonstrate histological sections of regenerating fins at levels whose approximate positions are indicated by red dotted arrowed lines. Black dashed lines indicate places of amputations. Abbreviations: bl - blastema, ep - epidermis.