
|
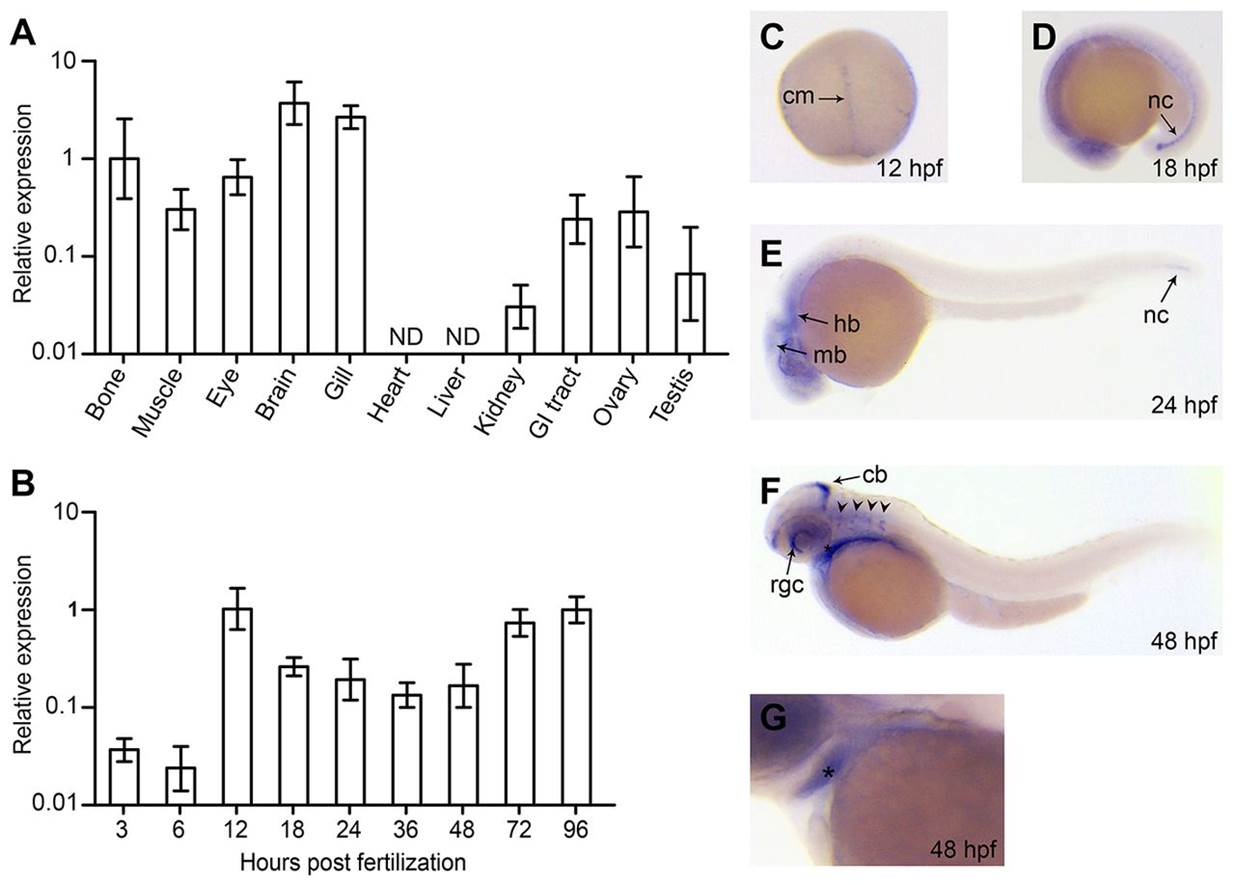
Fig. 2
Expression analysis of papp-a2 in zebrafish embryos, larvae and adults. (A) Quantitative RT-PCR analysis of papp-a2 mRNA in adult tissues. Analysis was performed on pooled organs from three females, with the exception of testes, which were dissected and pooled from two males. ND, not detected. (B) Quantitative RT-PCR analysis of papp-a2 expression levels during early development (30–50 embryos per group). papp-a2 expression was normalized relative to that of beta-2-microglobulin and fold change was calculated relative to bone (A) or 96 hpf (B), respectively. Plotted values are mean±s.d. of triplicate measurements. (C–G) Whole mount in situ hybridization showing papp-a2 expression at 12 (C), 18 (D), 24 (E), and 48 hpf (F,G). G is a magnified section of a stained 48 hpf embryo showing expression in the lower jaw (*). Anterior to the left, dorsal to the top, except 12 hpf, which is dorsal view, animal pole to the top. cm, chordamesoderm; nc, notochord; mb, midbrain; hb, hindbrain; cb, cerebellum; rgc, retinal ganglion cell layer; arrowheads, hindbrain ganglia. Identical staining patterns were observed when using two other non-overlapping probes, and no signal was observed using sense probe at any developmental stage (not shown).