
Fig. 4
|
Fig. 4
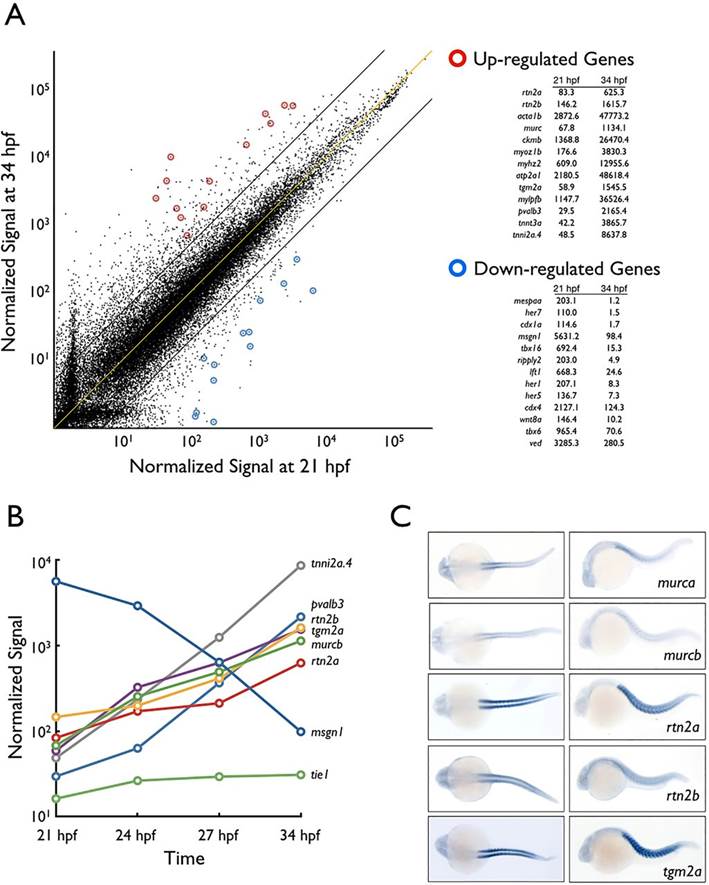
Translational profiling of zebrafish skeletal muscle. (A) Expression profile of 21hpf versus 34hpf skeletal muscle-specific TRAP mRNA assayed by microarray hybridization. Dots represent normalized hybridization signals of individual genes plotted on a log scale. Blue circles indicate downregulation over time whereas red circles indicate upregulation. The yellow line represents no difference in expression between samples whereas the black lines depict a fivefold change. (B) Timecourse of relative expression (log scale, y-axis) of selected genes from A. tie1 is an endothelial-specific gene and is minimally expressed. mesogenin (msgn1) is an example of a gene whose expression is downregulated during skeletal muscle development. (C) Whole-mount in situ hybridization at 28hpf of selected upregulated mRNAs. Dorsal (left) and lateral (right) views.