
|
Fig. S4
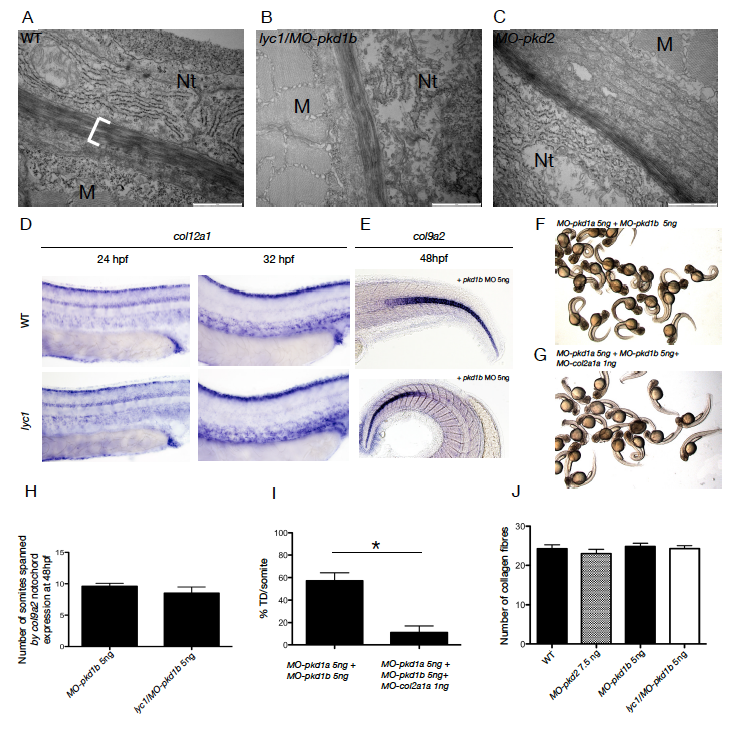
The lyc1 lymphatic vascular phenotype is independent of collagen gene expression and ECM changes. Related to Figure 2.
(A-C) Electron-microscopy imaging of the peri-notochordal region in WT, lyc1/MO-pkd1b (5ng MO) and MO-pkd2 embryos (7.5 ng MO). Nt=notochord, M=muscle.
(D) Expression of col12a1, a vascular collagen, was unchanged at 24 and 32 hpf in control (WT/MOpkd1b) (n=27, n=37 respectively) compared with phenotypically mutant lyc1/MO-pkd1b embryos (5ng MO) (n=37, n=12 respectively).(E) Expression of col9a2 was unchanged at 48 hpf in control (WT/MO-pkd1b) (n=10) compared with phenotypically mutant lyc1/MO-pkd1b embryos (5ng MO) (n=10).
(F-G) Overall morphology of (F) MO-pkd1a/MO-pkd1b (5ng MO each) and (G) MO-pkd1a/MOpkd1b/ MO-col2a1a morphants (5,5,1 ng MO respectively). Knockdown of Col2a1a rescues the gross curvature phenotype as previously described (Mangos et al., 2010).
(H). Quantification of col9a2 expression as the anterior posterior extent of expression in the notochord, delineated by somites boundaries. No increase in col9a2 extent was observed.
(I) Quantification of thoracic duct extent in MO-pkd1a/MO-pkd1b embryos (n=21) and pkd1a/pkd1b/col2a1a morphants (n=19). Despite rescue of the gross curvature phenotype, TD extent is not rescued. (J) Quantification of the number of collagen fibers in the medial layer of the peri-notochordal region in WT (n=3), WT/MO-pkd2 (7.5 ng MO) (n=3), WT/MO-pkd1b (5 ng MO) (n=3) and lyc1/MO-pkd1b embryos (5ng MO)(n=3). No change was observed in peri-notochordal collagen.