
|
Fig. 3
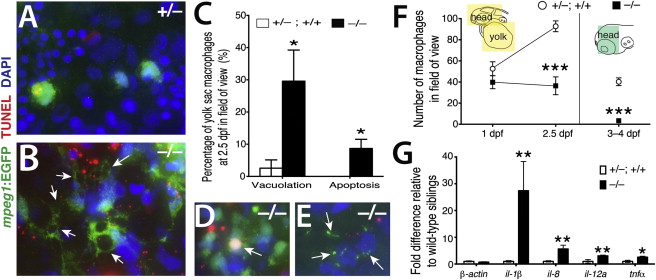
Inappropriate Inflammatory Activation of Macrophages in nlrc3-like/ Mutants
(A and B) High-magnification images show striking cell morphology differences between yolk sac macrophages of wild-type (A) and mutant (B). Macrophages in the mutants have multiple, large vacuoles (arrows).
(C) Plot shows significantly higher percentages of primitive macrophages (mpeg1-EGFP+) exhibiting vacuolation (one or more large cytoplasmic vacuoles; p = 0.047) and cell death (overlap of TUNEL staining with macrophage DAPI staining; p = 0.037) in nlrc3-like/ mutants (n = 5 embryos) compared with siblings (n = 6 embryos). Statistical significance was determined by the two-tailed Student’s t test.
(D and E) Examples of dying mutant macrophages exhibiting apoptosis (arrow in D), and cellular breakdown (arrows in E) are shown.
(F) Plot shows macrophage number over time. Diagram indicates the region of quantification (colored boxes): n = 5 for each genotype at 1 and 2.5 dpf, p = 0.0009 at 2.5 dpf; at 3–4 dpf, n = 7 siblings and n = 3 mutants (p = 2 × 10⁵).
(G) Graph shows relative mRNA levels of proinflammatory cytokines by qPCR comparing mutants (n = 6) to wild-type siblings (n = 6) at 3 dpf. p = 0.70 (β-actin), p = 0.002 (il-1β), p = 0.004 (il-8), p = 0.008 (il-12a), and p = 0.03 (tnfα).
n, number of independent embryos analyzed. Error bars show SEM. p < 0.05, p < 0.01, and p < 0.001. All p values are two tailed.