
Image
|
Figure Caption
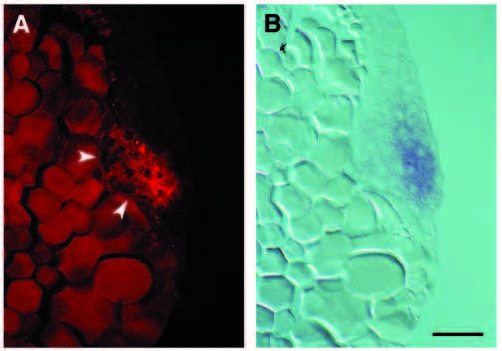
Fig. 6 flh expression in the early gastrula does not substantially overlap with gsc expression. (A) Epifluorescent (Texas Red filter set) and (B) bright-field views of a midsagittal section through the embryonic shield of an early gastrula that was hybridized with probes for both gsc (red) and flh (blue) RNA. White arrowheads in A indicate red fluorescence due to gsc expression in involuted cells (the yolk is autofluorescent at this wavelength). B shows flh expression is restricted to the epiblast. Scale bar, 50 μm.
Figure Data
Acknowledgments
This image is the copyrighted work of the attributed author or publisher, and
ZFIN has permission only to display this image to its users.
Additional permissions should be obtained from the applicable author or publisher of the image.
Full text @ Development