
Image
|
Figure Caption
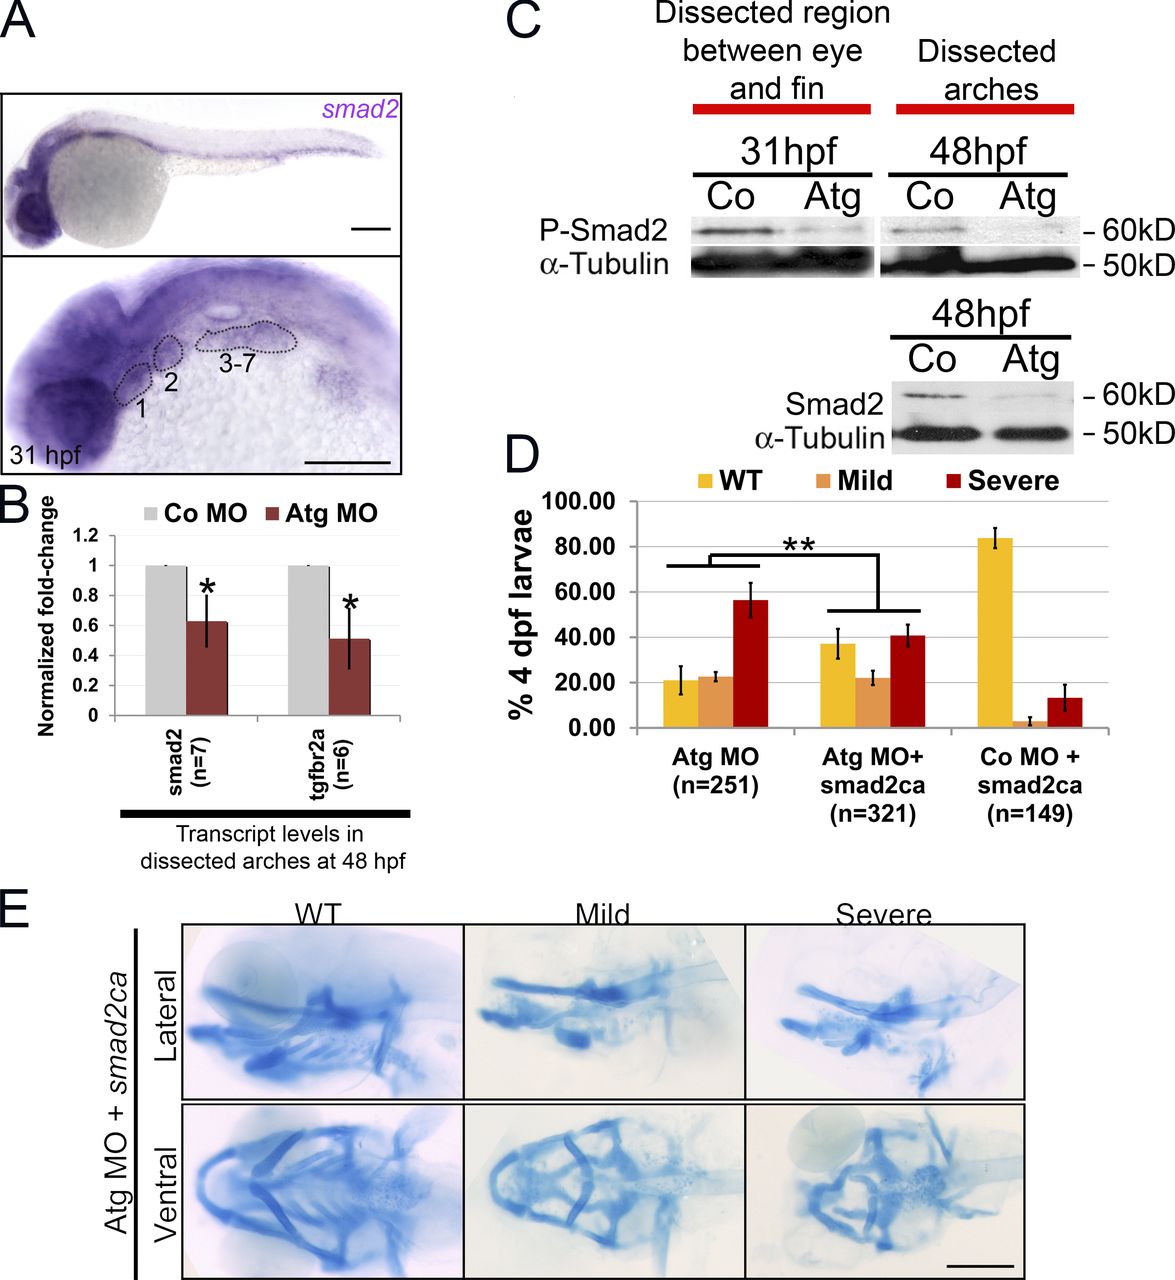
Fig. 7 Smad2 signaling is defective in rbms3 morphants. (A) At 31 hpf, smad2 is expressed in the pharyngeal arches (numbered and highlighted). (B) QPCR shows that smad2 and tgf-βr2a are reduced in rbms3 morphants at 48 hpf. Error bars indicate SD. *, P < 0.005 (two-tailed Student’s t test). n = independent pools of RNA. (C) pSmad2 (top) and total Smad2 (bottom) is reduced in rbms3 morphants. (D and E) Quantitation of phenotype (D) and cartilage staining (E) of fish coinjected with smad2ca and Atg MO. **, P < 0.001 (Χ2 test). Bars, 200 µM.
Figure Data
Acknowledgments
This image is the copyrighted work of the attributed author or publisher, and
ZFIN has permission only to display this image to its users.
Additional permissions should be obtained from the applicable author or publisher of the image.
Creative Commons License (Attribution–Noncommercial–Share Alike 3.0 Unported license, as described at http://creativecommons.org/licenses/by-nc-sa/3.0/ ).
Full text @ J. Cell Biol.