
|
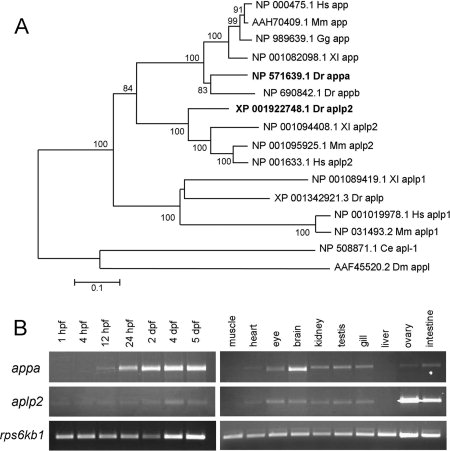
Fig. 2 Phylogenetic and expression analysis of zebrafish appa and aplp2. A: Phylogenetic tree of amyloid precursor proteins. Zebrafish Appa and Aplp2 are shown in bold. The horizontal bars represent the percentage of amino acid substitutions required to generate the corresponding tree. Ce, Caenorhabditis elegans; Dm, Drosophila melanogaster; Dr, Danio rerio; Gg, Gallus gallus; Hs, Homo sapiens; Mm, Mus musculus; Xl, Xenopus laevis. B: Relative expression levels of appa and aplp2 throughout zebrafish development and in adult tissues as evaluated by reverse transcriptase-polymerase chain reaction. Expression of the ribosomal protein S6 kinase b, polypeptide 1b (rps6kb1) gene was used as a control.