
|
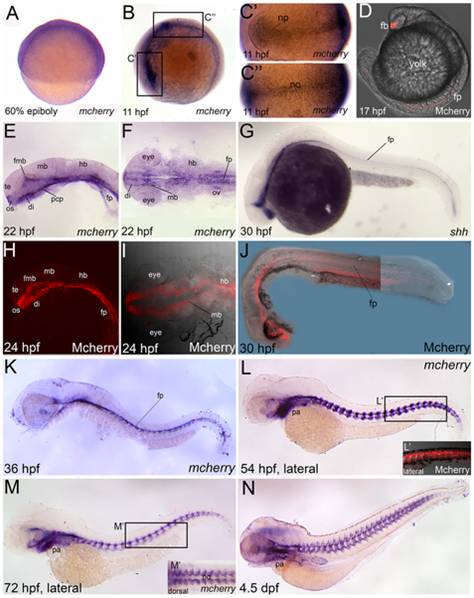
Fig. 3 mCherry reporter gene and protein expression reflects known Hh-expressing domains in Tg(Gli-d:mCherry).
Lateral views (A,B,D,E,G,H,J,K,L,L2,M,N) or dorsal views (C′,C",F,I,M′), anterior to the left, of Tg(Gli-d:mCherry) fish labeled with mCherry (A–F,K,L,M,N) or shh (G) riboprobes or mCherry protein which was visualized by confocal microscopy (H–J,L′). (A) mCherry is broadly expressed in blastomeres at 60% epiboly. (B–C") By 11 hpf, mCherry was localized to the neural plate (np) and the midline notochord (no) tissues. (D) At 17 hpf, mCherry protein was apparent in forebrain (fb) and floor plate (fp). (E–G) At 22–24 hpf, mCherry gene (E,F) and protein (H–J) are expressed in the fb, midbrain and fp, similar to shh gene expression (G) at a comparable stage. (K–N) At later stages from 2 to 4 dpf, mCherry is shown in whole-embryo lateral views and detectable in brain, fp, myotomal adaxial cells and PA. (L′) Confocal projections of Mcherry protein corresponding to boxed region in panel L revealed expression in the adaxial cells. (M′) Dorsal view of boxed region in panel M showed mCherry expression in adaxial cells and in somitic tissue neighboring the notochord in an orderly, segmental fashion. Abbreviations: di, diencephalon; fb, forebrain; fmb, forebrain-midbrain boundary; fp, floor plate; hb, hindbrain; mb, midbrain; np, neural plate; no, notochord; os, optic stalk; ov, otic vesicle; PA, pharyngeal arches; pcp, prechordal plate; te, telencephalon.