
|
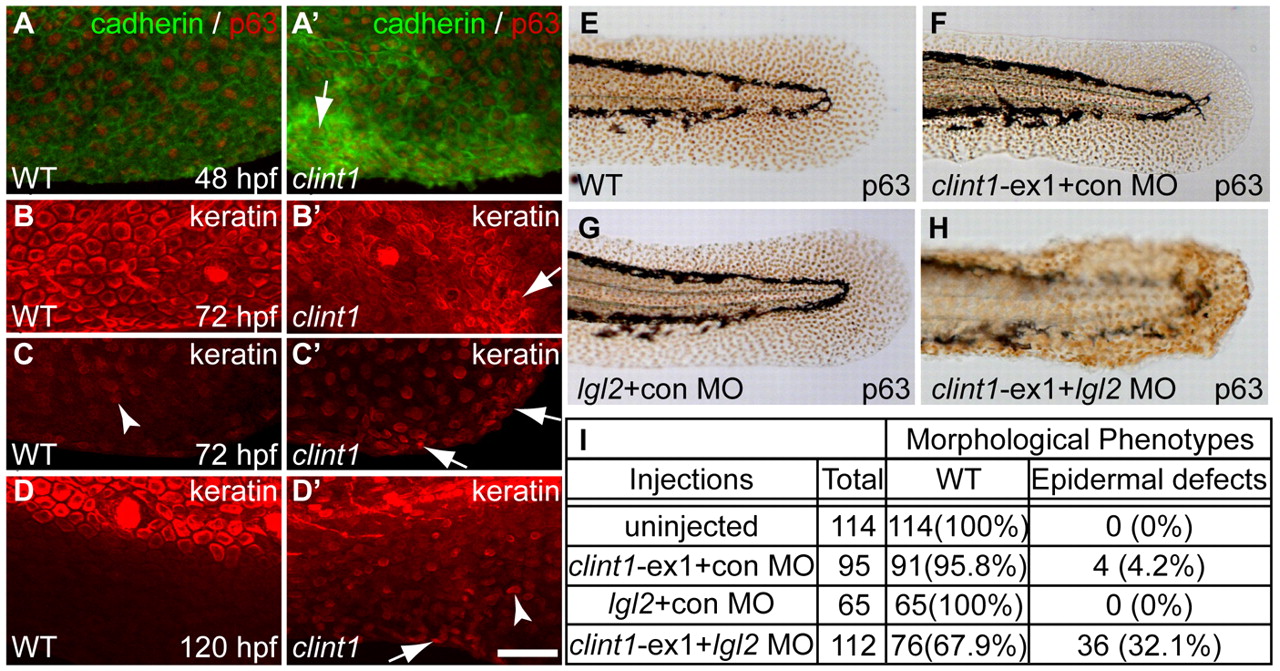
Fig. 6 Epidermal aggregation in clint1 mutants and interaction with lgl2. (A-D′) Wild-type (A-D) and clint1 mutant (A′-D′) zebrafish embryos staged at 48 (A,A′), 72 (B,C,B′,C′) and 120 (D,D′) hpf and immunolabeled for cadherin (green) and p63 (red) (A,A′) or for keratin (red) (B-D,B′-D′). Arrows (A′-D′) identify keratinocyte aggregation. Arrowheads (C,D′) identify keratin expression within fin folds. (E-H)p63 expression highlights epidermal morphology in uninjected (E), clint1-ex1 plus control MO (F), lgl2 plus control MO (G), or clint1-ex1 plus lgl2 MO (H) co-injected wild-type embryos. (I) Quantification of morphological phenotypes observed in E-H. Scale bar: 50 μm.