
|
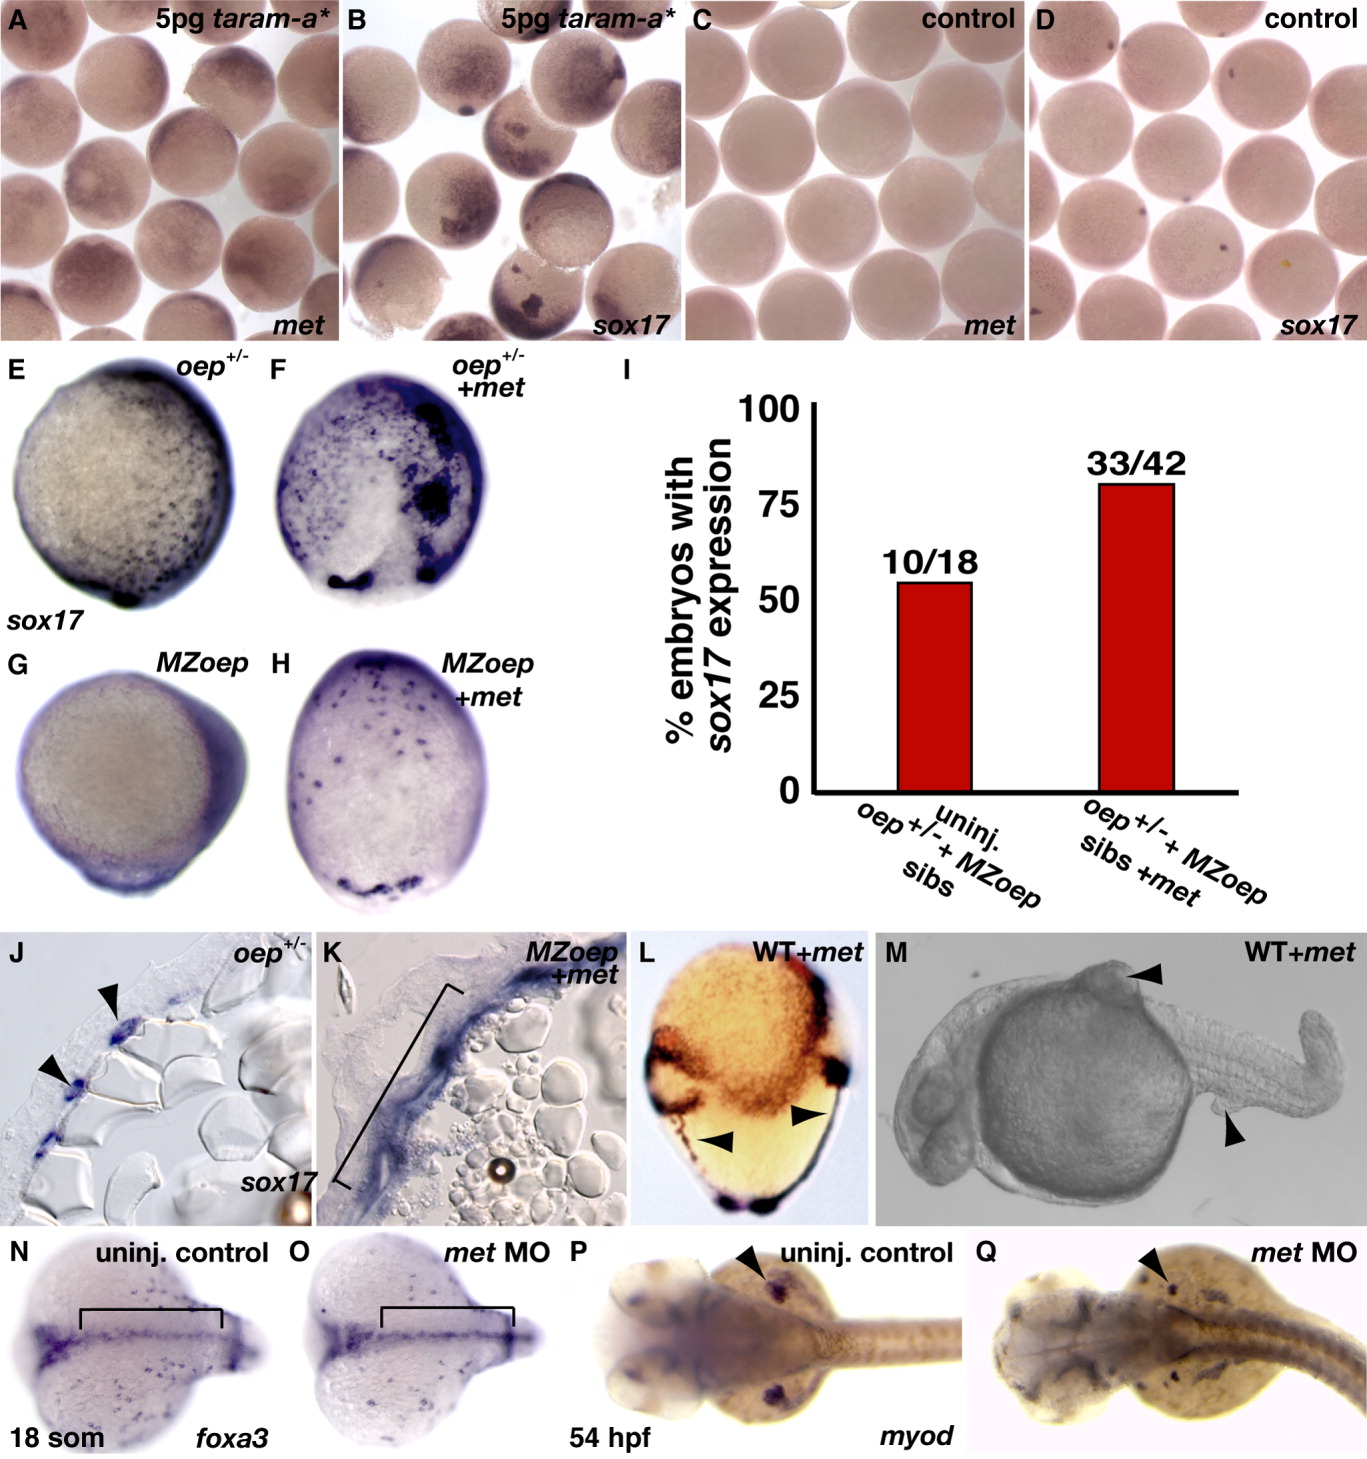
Fig. 2 Nodal signaling induces c-met expression and Met promotes endoderm formation. A-D: sox17 and c-met expression in representative groups of embryos injected mosaically with 5 pg taram-a* mRNA (A,B) and control uninjected embryos stained for the same amount of time (C,D). E,G: Lateral views (anterior to the top and dorsal to the right) of uninjected oep+/- and MZoep-/- controls labeled with sox17. F,H: Dorsal views (anterior to the top) of oep+/- and MZoep-/- embryos injected with 100 pg c-met mRNA and labeled with sox17. I: Quantification of the numbers of sox17-expressing uninjected and c-met mRNA-injected oep+/- and MZoep-/- siblings. J,K: Transverse sections of uninjected oep+/- and 100 pg c-met mRNA injected MZoep-/- late gastrula-stage embryos labeled with sox17 (J, arrowheads denote endodermal cells; K, bracket denotes expanded sox17 expression). L: Lateral view (anterior to the top) of a wild-type embryo injected with 100 pg of c-met mRNA and probed for hgg1, pax2a, dlx3, and shh expression (arrowheads mark two embryonic axes; the original axis is to the right). M: Ventrolateral view of a live 24-hr embryo injected with 100 pg of c-met mRNA. Hyperplastic growths are visible ventral to the yolk tube extension and on the lateral part of the yolk ball (arrowheads). N,O: Eighteen-hour (18 somite-stage) uninjected control and c-met AUG MO-injected embryos, dorsal views, showing normal foxa3 expression in medially migrated endodermal precursor cells (brackets). P,Q: Uninjected control and c-met AUG MO-injected embryos showing dorsal views of 54-hr embryos depicting myod expression in the fin buds (arrowheads).