
|
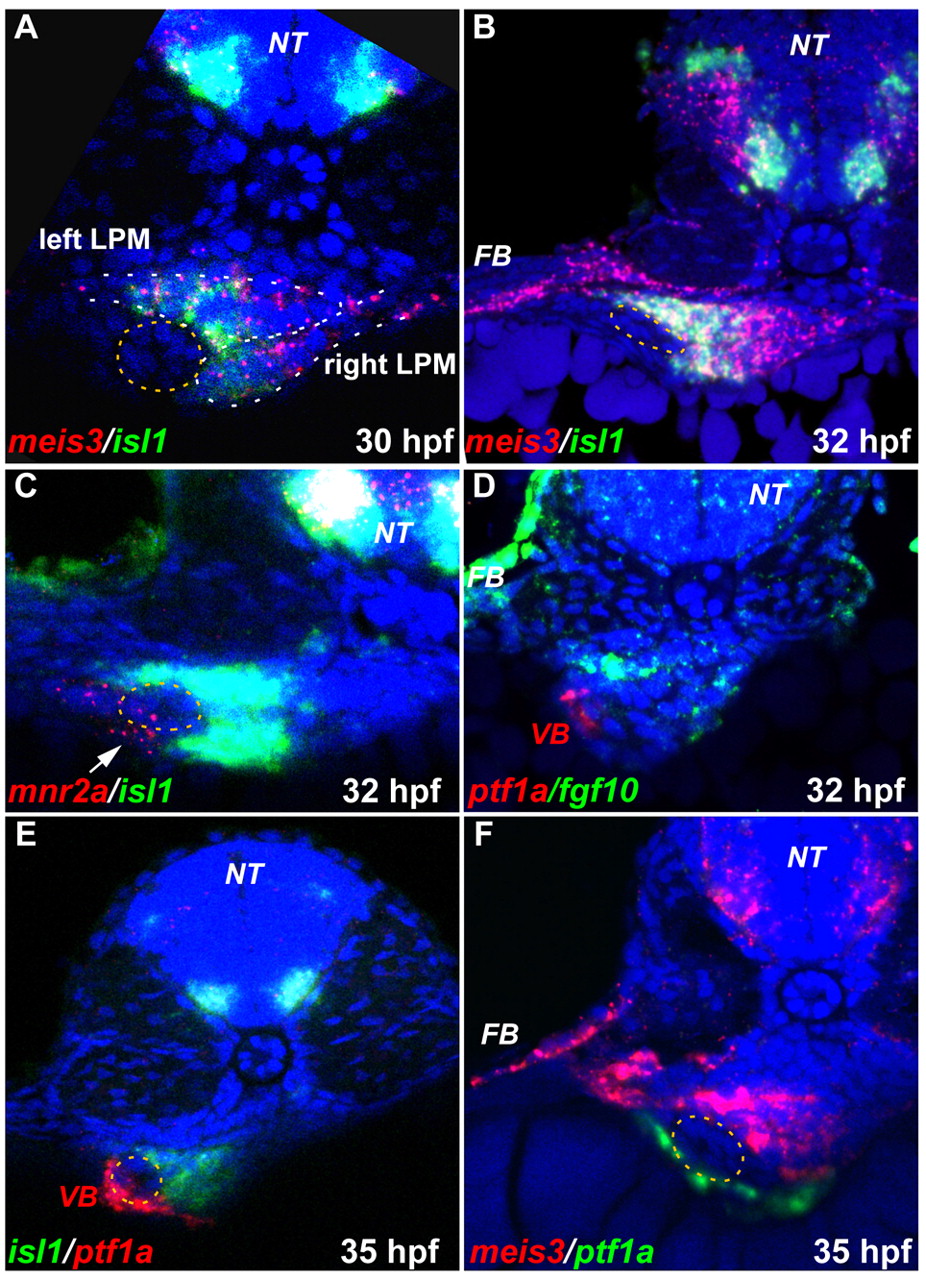
Fig. 2 isl1 and meis3 label the LPM next to the developing ventral pancreatic bud. Confocal analysis of transverse sections of embryos stained by fluorescent whole-mount in situ hybridization with two probes (red and green) through the pancreatic region. Nuclear staining was achieved with TO-PRO-3 (633 nm) and artificially colored in blue. The left side of the embryo is situated to the left in all panels. (A,B) meis3 (red) and isl1 (green) expression at 30 hpf (A) and 32 hpf (B). (C) isl1 expression with mnr2a at 32 hpf. (D) Expression of fgf10 (green) and ptf1a (red) at 32 hpf. (E) isl1 (green) and ptf1a (red) expression at 35 hpf. (F) meis3 (red) and ptf1a (green) expression at 35 hpf. On transverse section in A, the white dotted lines highlight the left and right LPM. In A-F, the yellow dotted lines encircle the gut tube. The white arrows indicate the appearing ventral bud cells. Owing to the low levels of mnr2a and fgf10 expression, the views in C and D are flat stacking of several consecutive optical sections. VB, ventral pancreatic bud; DB, dorsal pancreatic bud; FB, pectoral fin bud; NT, neural tube.