
|
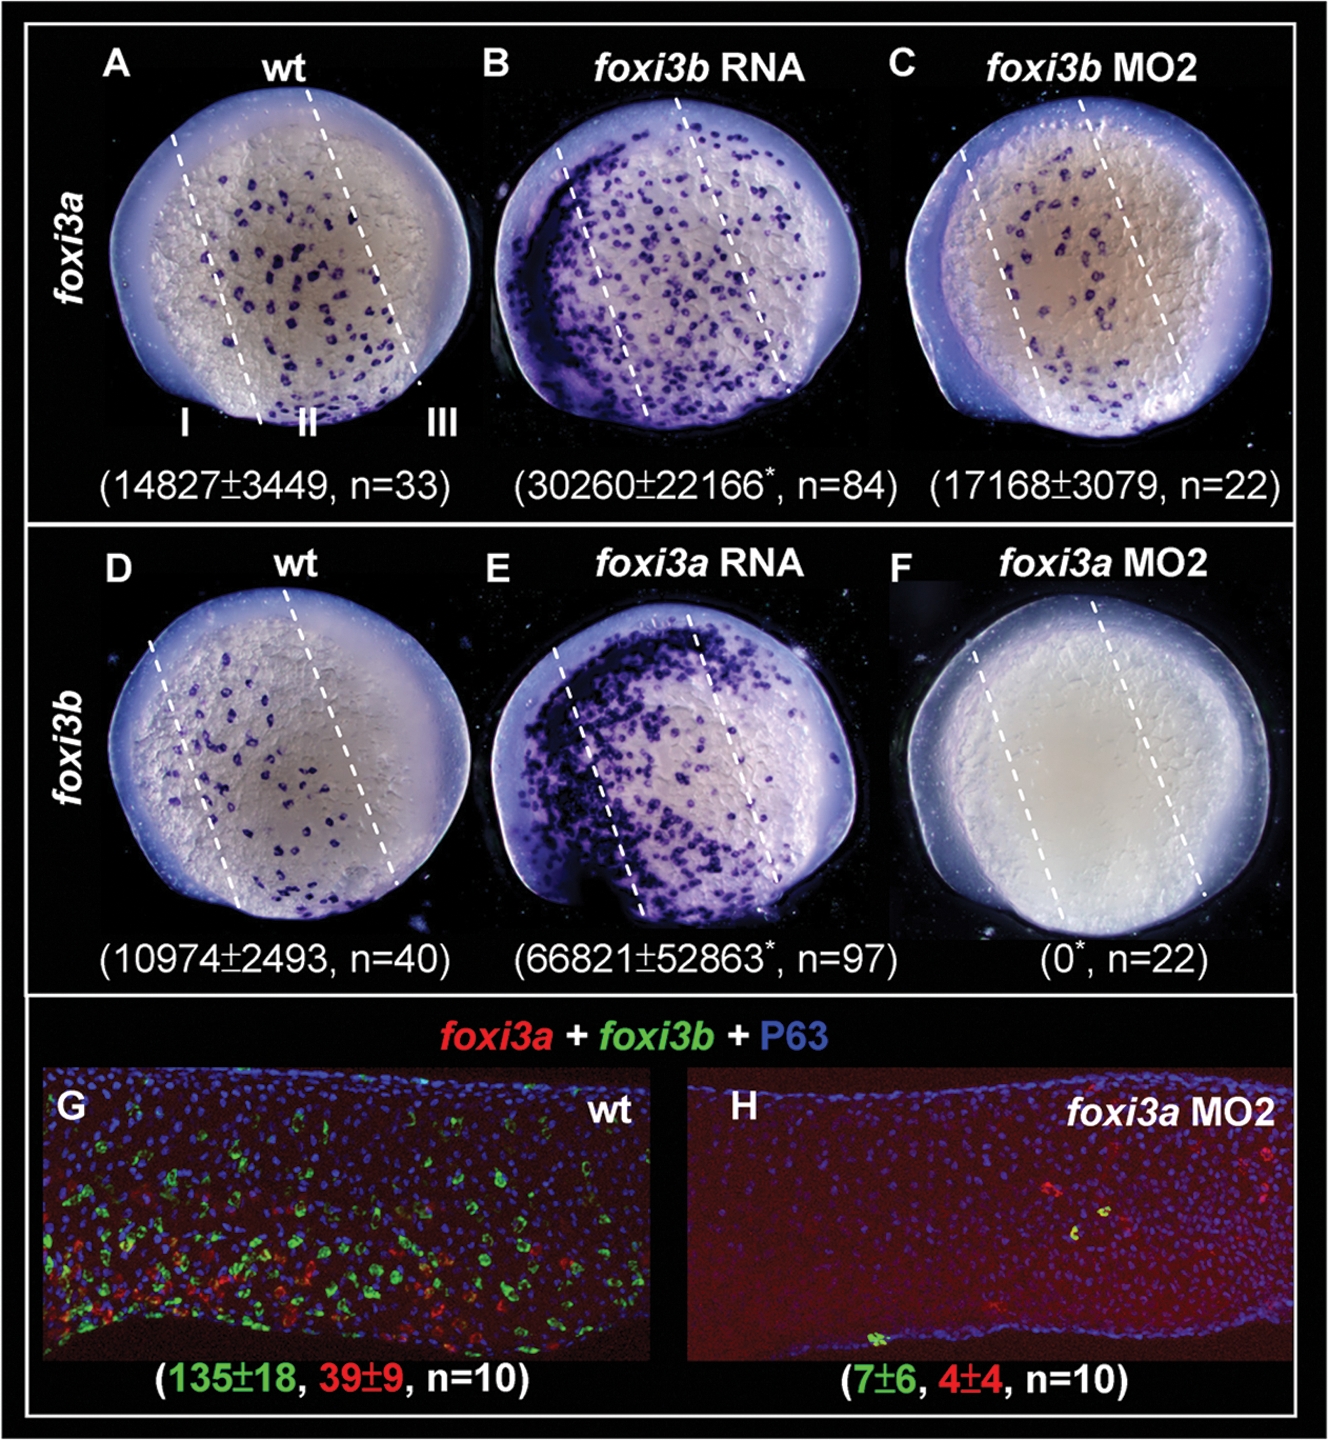
Fig. 6 Reciprocal Regulation of foxi3a and foxi3b by a Positive Feedback Regulatory Loop. (A–C) Detection of foxi3a expression in wild-type (wt) embryos, foxi3b mRNA-injected embryos, and foxi3b morphants at the 5-somite (5-s) stage. (D–F) Detection of foxi3b expression in wt embryos, foxi3a mRNA-injected embryos, and foxi3a morphants at the 5-s stage. The foxi3a+ or foxi3b+ area was measured by ImageJ software and is presented as the mean±S.D (µm2). Asterisks indicate p<0.05 when compared with the wild-type embryos, as determined by Student's t-test. To highlight the position of ectopic epidermal ionocytes which were generated by misexpressing either foxi3a or foxi3b, the epidermal ectoderm is subdivided into three domains of I, II and III by dotted lines. (G–H) Comparison of foxi3a (red) and foxi3b (green) expressions between 24-hour post-fertilization (hpf) wt embryos and foxi3a morphants. The number of foxi3a-(red) and foxi3b-(green) expressing ionocytes is indicated in the bottom.