
|
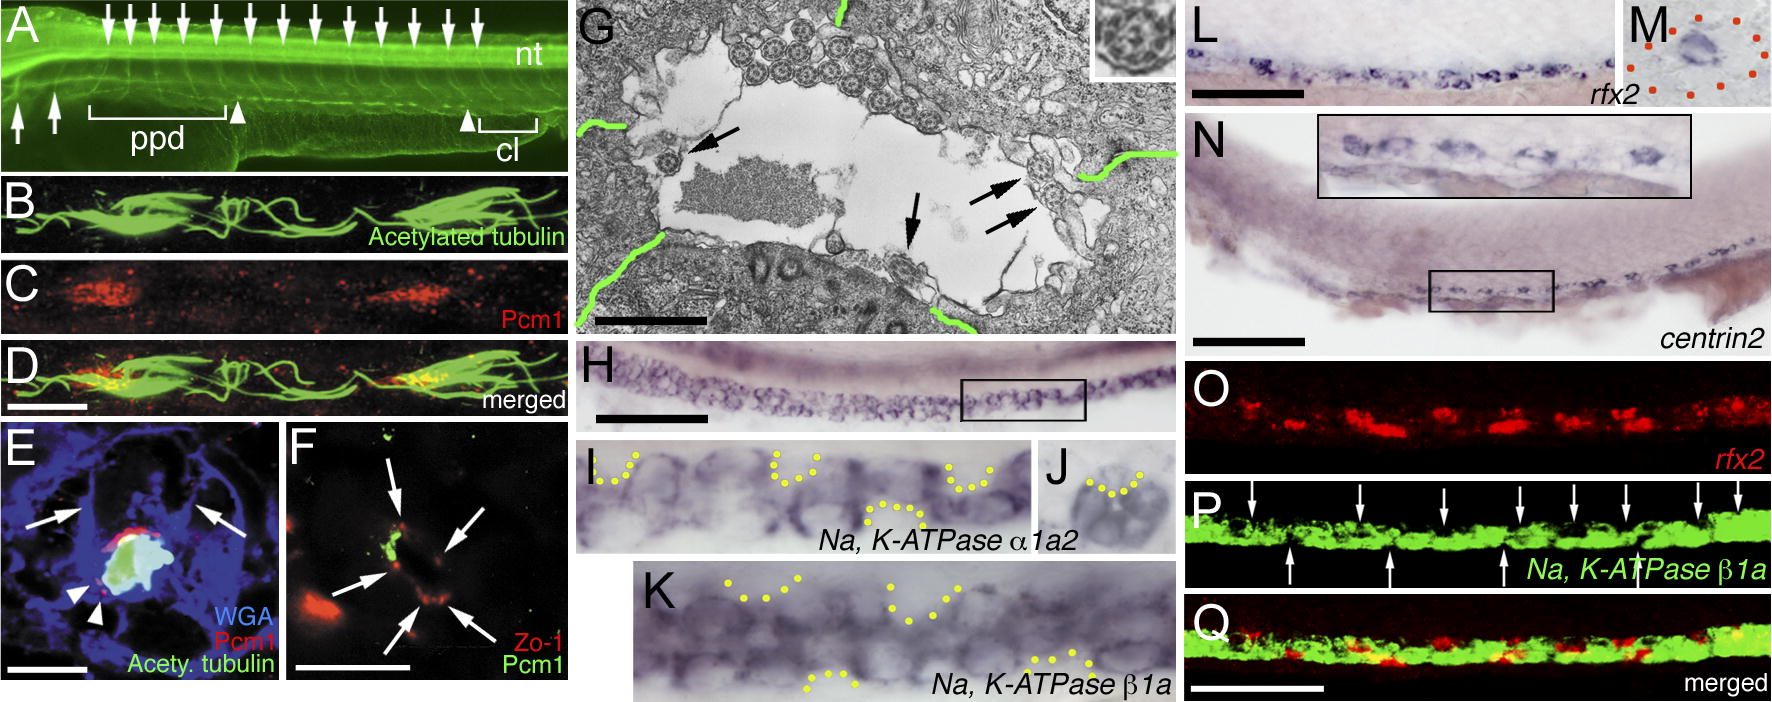
Fig. 1 Multi-Cilia Cells and Principal Cells Interpolate in the Pronephric Duct Embryo in (A) is 48 hpf, embryos in (O–Q) are 27 hpf, and all others are 36 hpf. (A) Acetylated tubulin staining revealed that cilia tufts are located in the lumen of the distal (demarcated by arrowheads) but not proximal pronephric duct (ppd) or cloaca (cl). Arrows point to the ventral axons of caudal primary motor neurons (CaP), which project approximately midway within each somite [94]. nt, neural tube. (B–D) Antibody staining of (B) acetylated tubulin, (C) Pcm1, and (D) merged image revealed that multiple basal bodies associate with each cilia tuft. (E) Antibody staining of acetylated tubulin (green) and Pcm1 (red) on transverse section of pronephric duct (counter-stained with WGA [blue]) revealed that the cilia tuft is within the lumen and there are multiple basal bodies within one cell. Arrows mark the cell membrane and arrowheads point to the individual Pcm1 staining in the neighboring cells. (F) Antibody staining of Pcm1 (green) and Zo-1 (red) on a transverse section of the pronephric duct revealed that multiple basal bodies are localized to the apical side of one cell. Arrows point to the Zo-1 staining. (G) Transmission electron microscope view of the lumen revealed that the cilia tuft contains at least 15 cilia in a closely organized manner and that individual primary cilia are present (arrows), all with the typical 9 + 2 structure (insert). Green lines demarcate cell borders. (H–K) Whole-mount (H, I, and K) and transverse section (J) in situ staining of sodium pump genes (H–J) Na+, K+ ATPase α1a2 and (K) Na+, K+ ATPase β1a revealed that these genes are not expressed in some individual cells (demarcated by yellow dotted lines). (I) Magnified image of the box in (H). (L and M) Whole-mount (L) and transverse section (M) in situ staining of rfx2 revealed that rfx2 is expressed in individual cells. The red dotted line in (M) outlines the duct. (N) Whole-mount in situ staining of centrin2 revealed that centrin2 is expressed in the individual cells; the insert on the top is a magnified image of the box below. (O–Q) Fluorescent double in situ staining revealed that (O) rfx2 and (P) Na+, K+ ATPase β1a are expressed in different cells. Arrows point to the cells that do not express Na+, K+ ATPase β1a. (Q) Merged image of (O) and (P); perceived costaining of rfx2 and Na+, K+ ATPase β1a in some cells of the duct is an artifact caused by viewing at a single angle. Bar scale: 100 μm (A [bar in (D)]), 10 μm (B–D [bar in (D)], E, and F), 1 μm (G), 100 μm (H), 25 μm (I–K, [bar in (H)]), 70 μm (L), 25 μm (M, [bar in (L)]), 100 μm (N), 50 μm (O–Q [bar in (Q)]).