
Fig. 2.
- ID
- ZDB-FIG-240508-18
- Publication
- Wilson et al., 2024 - A maternal-to-zygotic-transition gene block on the zebrafish sex chromosome
- Other Figures
- All Figure Page
- Back to All Figure Page
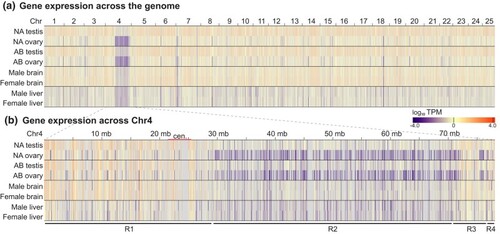
Gene expression in gonads and in somatic organs measured by log10 TPM. a) A heatmap showing TPM levels for annotated protein-coding genes across the genome in male and female gonads of strain NA and AB and in male and female somatic organs (brain and liver) for strain AB plotted against position. Color scale below at right. b) A heatmap showing TPM along the length of Chr4 for the same samples as in a). Plots revealed low transcript levels in Region-2, especially in ovaries of both Nadia and AB, and that, although gene expression was also low in Region-2 in strain AB brain and liver, it was not sexually dimorphic in these somatic organs. |