FIGURE SUMMARY
Title

A maternal-to-zygotic-transition gene block on the zebrafish sex chromosome

Authors
Wilson, C.A., Postlethwait, J.H.
Source
Full text @ G3 (Bethesda)

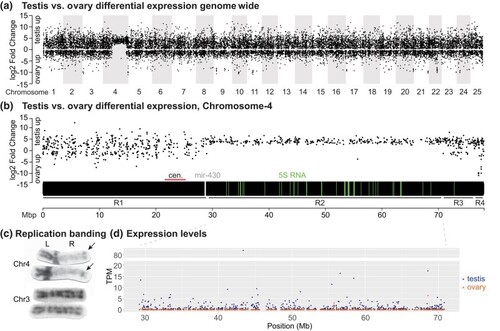
Testis vs ovary differential gene expression. a) Testis vs ovary differential expression plotted against genomic position across the 25 zebrafish chromosomes. The plot shows unique and specific upregulation of testis genes vs ovary genes on Chr4, the sex chromosome. b) Testis vs ovary differential expression across Chr4. The plot identified 4 distinct regions: R1, with values similar to the bulk of the genome; R2, with testis expression on average much higher than ovary expression; R3, again with values similar to most of the genome; and R4, with some strongly ovary-biased genes and coincident with sar4 containing the major sex-determining locus. The horizontal black bar represents Chr4, with the location of the centromere (horizontal red line) located by alignment of the centromeric markers BX537156 (Freeman et al. 2007) and Z20450 (Mohideen et al. 2000) to GRCz11; the positions of maternal 5S ribosomal genes (Locati, Pagano, Ensink et al. 2017) are indicated by green vertical lines, and mir430 genes are marked by white vertical lines. c) Replication banding of Chr4 and Chr3 (Amores and Postlethwait 1999; Phillips et al. 2006). Karyotypes showed dark staining (early replicating DNA) on the short (left) arm of Chr4 and at the distal tip of the long (right) arm of Chr4, in contrast to pale staining (late-replicating DNA) in the position expected for R2 on Chr4R, while only thin light bands appeared on all other chromosomes, represented here by Chr3. d) The absolute level of gene expression in transcripts per kilobase of gene length per million total reads (TPM) for all protein-coding genes within Region-2 of Chr4, showing that transcripts were detected from most genes in testis (blue) but transcript count was near 0 from most genes in ovary (red).

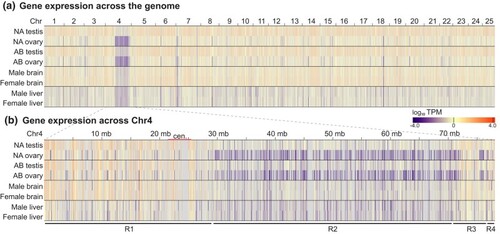
Gene expression in gonads and in somatic organs measured by log10 TPM. a) A heatmap showing TPM levels for annotated protein-coding genes across the genome in male and female gonads of strain NA and AB and in male and female somatic organs (brain and liver) for strain AB plotted against position. Color scale below at right. b) A heatmap showing TPM along the length of Chr4 for the same samples as in a). Plots revealed low transcript levels in Region-2, especially in ovaries of both Nadia and AB, and that, although gene expression was also low in Region-2 in strain AB brain and liver, it was not sexually dimorphic in these somatic organs.

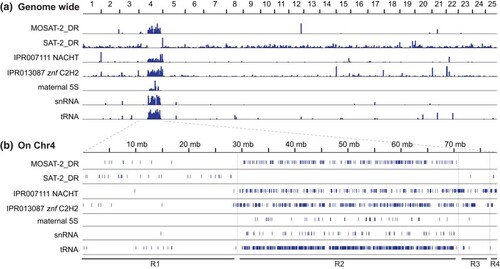
Distinctive features of Chr4. a) Distribution of sequences across the 25 zebrafish chromosomes for satellite sequences MOSAT-2 and SAT2, genes encoding the protein-coding domains IPR007111 NACHT, genes encoding IPR013087 C2H2-type zinc fingers, and certain nonprotein-coding genes including maternal 5S rRNA genes (somatic 5S rRNA genes on Chr18 not shown), snRNA genes, and tRNA genes. b) Positions of these sequences along Chr4 are specifically enriched or excluded from Region-2 (Anderson et al. 2012; Howe et al. 2013; Howe et al. 2016). MOSAT-2 is largely restricted to Region-2, while reciprocally, SAT-2 is absent from Region-2. Maternal 5S genes, snRNAs, and tRNAs are largely restricted to Region-2, while NACHT domain containing NLR genes and zinc finger genes are distributed along the length of Chr4R. Although several of these factors had been reported to be specific for Chr4R, we show here that, except for the NACHT and ZNF families, they are unique to Region-2.

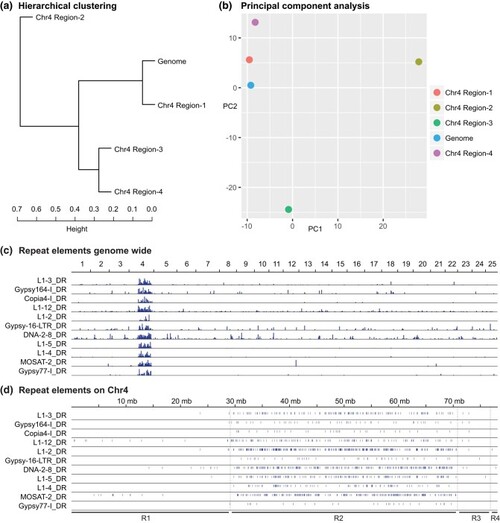
Distribution of repetitive elements. a) Hierarchical clustering analysis of repetitive element composition in the 4 regions of Chr4 and in the rest of the zebrafish genome (Chr1–Chr3 plus Chr5–Chr25). b) PCA analysis of repetitive element composition shows that Region-2 of Chr4 is distinct from the rest of the genome. c) Genomic distribution of several repeat elements contributing to PC1 shows them to be clustered on Chr4R. d) Distribution of these repeats along Chr4 shows that they tend to concentrate in Region-2.

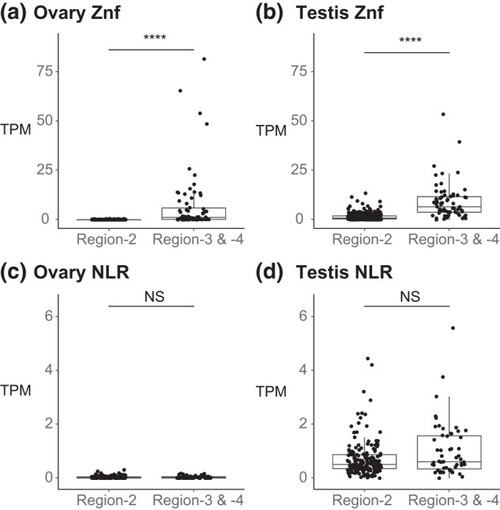
Comparison of expression levels of zinc finger and NLR genes in Region-2 vs Region-3 + Region-4. a) In the ovary, znf genes in Region-2 were not expressed but some znf genes in Region-3 + Region-4 were expressed. b) In the testis, some znf genes in Region-2 were expressed weakly and many znf genes in Region-3 + Region-4 were expressed more strongly. c) In the ovary, NLR genes were nearly silent in both Region-2 and Region-3 + Region-4. d) In the testis, NLR genes in Region-2 were expressed about as much as NLR genes in Region-3 + Region-4. Significance levels: NS, not significant (P > 0.05); ****, significant at P < 0.0001.

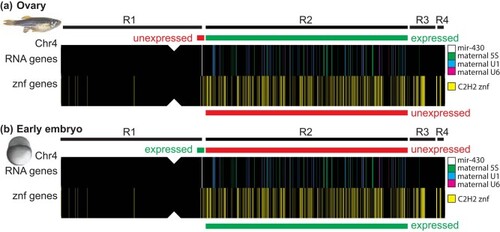
A maternal-to-zygotic-transition gene block. a) In the ovary, oocytes express maternal 5S rRNA (green vertical bars on the chromosome sketch) and spliceosome genes (U1, U6; blue and mauve) in Region-2 but not znf genes (yellow) in Region-2 or the adjacent mir430 genes (white) (Locati, Pagano, Ensink et al. 2017; Locati, Pagano, Girard et al. 2017; Locati et al. 2018; Pagano, Dekker et al. 2020; Pagano, Locati et al. 2020). The 5S ribosomal and the spliceosomal maternal transcripts help make the machinery to translate proteins essential for embryogenesis from maternal mRNAs before expression of the zygotic genome. Maternal 45S genes are in Region-4 (not indicated in the sketch) (Ortega-Recalde et al. 2019). b) Reciprocally, early embryos at the beginning of the maternal-to-zygotic transition do not express maternal 5S rRNA or maternal spliceosome (U1, U6) genes in Region-2, but do express Region-2 znf genes and the nearby mir430 genes. Znf proteins may help to stabilize the mobility of transposable elements (White et al. 2017; Hadzhiev et al. 2019; Wells et al. 2023) and the mir430 mature products promote clearance of maternal messenger RNAs (Giraldez et al. 2005; Takacs and Giraldez 2016; Giraldez et al. 2006; Lund et al. 2009). R1, R2, R3, and R4 represent Regions-1 to -4.

Acknowledgments
This image is the copyrighted work of the attributed author or publisher, and ZFIN has permission only to display this image to its users. Additional permissions should be obtained from the applicable author or publisher of the image. Full text @ G3 (Bethesda)