
Fig.4
- ID
- ZDB-FIG-240503-49
- Publication
- Sun et al., 2012 - A benchmarked protein microarray-based platform for the identification of novel low-affinity extracellular protein interactions
- Other Figures
- All Figure Page
- Back to All Figure Page
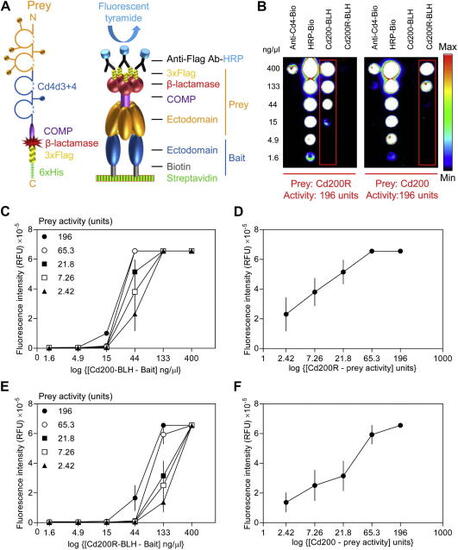
Microarray AVEXIS specifically detects low-affinity extracellular interactions with high sensitivity. (A) A schematic diagram of the pentamerized prey protein and how it is used in the microarray-based AVEXIS assay. Whole ectodomains of cell surface receptor proteins (yellow) are expressed as soluble Cd4-tagged proteins pentamerized by a peptide from the cartilage oligomeric matrix protein (COMP), followed by the β-lactamase enzyme and a triple-Flag tag for detection and a 6×His tag for purification if necessary. The prey is used to probe arrays of bait proteins immobilized on a streptavidin-coated microarray slide. Captured Flag-tagged preys are detected by an anti-Flag HRP-conjugated antibody and then quantified using the deposition of an Alexa Fluor 555 tyramide derivative. (B) Detection of the rat Cd200–Cd200R interaction in both bait–prey orientations by microarray AVEXIS. Serial dilutions of biotinylated rat Cd200–BLH and Cd200R–BLH were immobilized and probed with 196 U of Cd200R (left panel) and CD200 (right panel) preys. The Cd200–Cd200R interaction (within red boxes) was detected in both bait–prey orientations. Serial dilutions of a biotinylated anti-Cd4 antibody (to directly capture the prey via its Cd4 tag) and biotinylated HRP were immobilized as positive controls. (C–F) Determining the sensitivity of the assay to bait and prey activities. Panels C and E show how fluorescence intensity varies according to the bait and prey dilutions when either Cd200 (C) or Cd200R (E) are immobilized as the bait. Panels D and F show a slice through the data shown in panels C and E at bait concentrations of 44 and 133 ng/μl, respectively, illustrating the essentially linear response of the signal to the prey activity. RFU, relative fluorescence units. Data points are means ± standard errors ( |