
- Title
-
A benchmarked protein microarray-based platform for the identification of novel low-affinity extracellular protein interactions
- Authors
- Sun, Y., Gallagher-Jones, M., Barker, C., Wright, G.J.
- Source
- Full text @ Anal. Biochem.
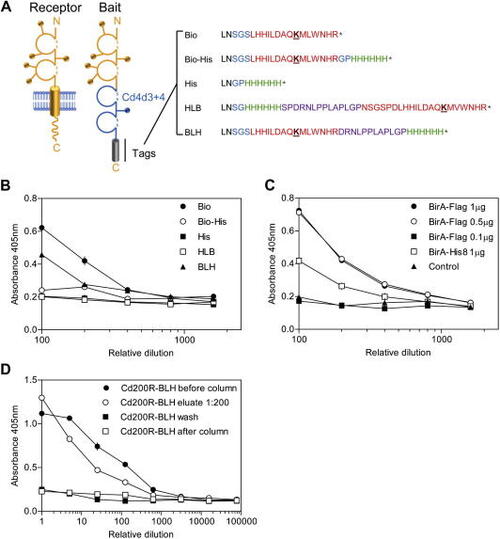
Design of a recombinant protein tag for efficient biotinylation and purification of monomeric proteins for capture on streptavidin-coated surfaces. (A) A schematic diagram showing the sequences of the C-terminal tags used in this study. A cartoon of a typical membrane-embedded type I cell surface receptor is shown next to the corresponding soluble ectodomain expressed as a bait. Lollipops represent potential N-linked glycosylation sites. The sequences of the C-terminal tags are shown and named. “LN” marked in black is the C-terminal end of the Cd4 tag. The peptide sequence that is a substrate for the BirA enzyme is highlighted in red, and the biotinylatable lysine residue is underlined. Flexible linkers and structurally insulating sequences are shown in purple and blue respectively, and oligo-histidine is shown in green. (B) Comparison of the biotinylation efficiencies of a rat Cd200R bait protein containing different C-terminal tags. The different Cd200R bait proteins were expressed with the modified BirA plasmid, normalized to 1 μg/ml, serially diluted on streptavidin-coated microtiter plates, and quantified by ELISA. (C) Cd200R-Bio- |
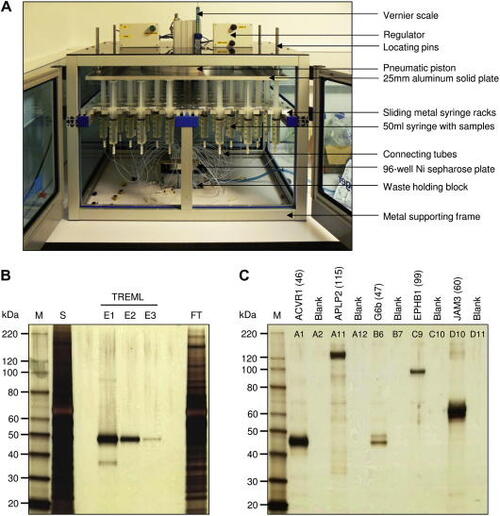
A protein purification system for the parallel purification of 96 large tissue culture volumes. (A) The loading press can purify up to 96 50- to 100-ml samples of His-tagged proteins in parallel. It consists of a pneumatic piston attached to an aluminum plate that is used to drive tissue culture supernatants loaded in 50-ml disposable syringes through tubes that are connected to a holding block containing the 96-well Ni2+–NTA resin filter plate. (B) Proteins are purified to greater than 90% purity using the custom loading apparatus. A typical human cell surface receptor protein (TREML) was cloned into the BLH vector and expressed, and 50 ml of spent supernatant was loaded onto a single well of a 96-well microtiter plate containing Ni2+–NTA resin. Three serial 200-μl elutions were performed (E1–E3), and 20 μl of a 1:4000 dilution was loaded and resolved by sodium dodecyl sulfate–polyacrylamide gel electrophoresis (SDS–PAGE) under reducing conditions and detected using silver staining. S = 18 μl spent supernatant; FT = 18 μl flow-through; M = markers. (C) No cross-well contamination is detected using the protein purification system. A purification experiment was set up with 48 transfection supernatants and intentionally included blank wells containing tissue culture medium alone to test for cross-well contamination. Eluates from the plate (including neighboring blank wells) were diluted 1:4000, and 20 μl was resolved by SDS–PAGE under reducing conditions and detected by silver staining. The gel shows representative purified bait proteins at the expected mass together with the eluate from neighboring blank wells showing no cross-well contamination. |

Optimization of biotinylated bait immobilization on streptavidin-coated microarrays. (A) A purified biotinylated Cd200R–BLH protein was serially diluted at the indicated concentrations in three different PBS/0.5% BSA-based buffers before being printed using 400-μm-diameter solid pins on streptavidin-coated slides (XanTec). Buffers were based on a PBS/0.5% BSA solution but contained either 0.02% Tween 20 and 1% polyethylene glycol (PEG, average mass = 8 kDa) or 10% glycerol. The buffer containing 0.02% Tween 20 reproducibly immobilized the most protein with the best spot morphology. (B) The top panel shows a representative image of a protein microarray containing a dilution series of six different proteins that were arrayed on a streptavidin-coated slide before being incubated with an anti-rat Cd4 monoclonal antibody followed by an anti-mouse Cy3-conjugated secondary. The bottom panel graphically shows quantitation of the fluorescence intensities from triplicate arrays on the same slide. Biotinylated bait proteins were specifically captured, as shown by saturation of immobilized bait at 400 μg/ml and lack of immobilization of an unbiotinylated control. The biotinylated anti-Cd4 monoclonal antibody (Anti-Cd4-Bio) serves as a positive control. Data points represent the means ± standard errors ( |
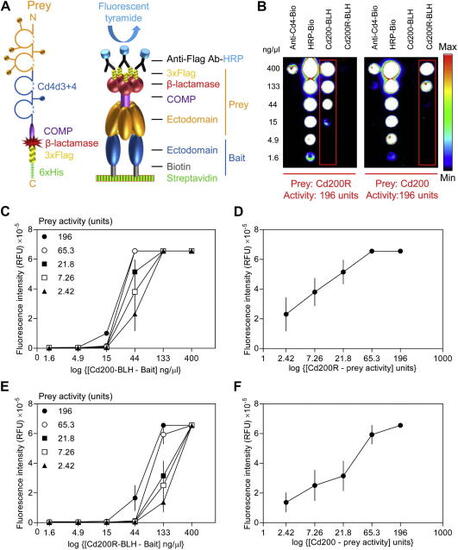
Microarray AVEXIS specifically detects low-affinity extracellular interactions with high sensitivity. (A) A schematic diagram of the pentamerized prey protein and how it is used in the microarray-based AVEXIS assay. Whole ectodomains of cell surface receptor proteins (yellow) are expressed as soluble Cd4-tagged proteins pentamerized by a peptide from the cartilage oligomeric matrix protein (COMP), followed by the β-lactamase enzyme and a triple-Flag tag for detection and a 6×His tag for purification if necessary. The prey is used to probe arrays of bait proteins immobilized on a streptavidin-coated microarray slide. Captured Flag-tagged preys are detected by an anti-Flag HRP-conjugated antibody and then quantified using the deposition of an Alexa Fluor 555 tyramide derivative. (B) Detection of the rat Cd200–Cd200R interaction in both bait–prey orientations by microarray AVEXIS. Serial dilutions of biotinylated rat Cd200–BLH and Cd200R–BLH were immobilized and probed with 196 U of Cd200R (left panel) and CD200 (right panel) preys. The Cd200–Cd200R interaction (within red boxes) was detected in both bait–prey orientations. Serial dilutions of a biotinylated anti-Cd4 antibody (to directly capture the prey via its Cd4 tag) and biotinylated HRP were immobilized as positive controls. (C–F) Determining the sensitivity of the assay to bait and prey activities. Panels C and E show how fluorescence intensity varies according to the bait and prey dilutions when either Cd200 (C) or Cd200R (E) are immobilized as the bait. Panels D and F show a slice through the data shown in panels C and E at bait concentrations of 44 and 133 ng/μl, respectively, illustrating the essentially linear response of the signal to the prey activity. RFU, relative fluorescence units. Data points are means ± standard errors ( |
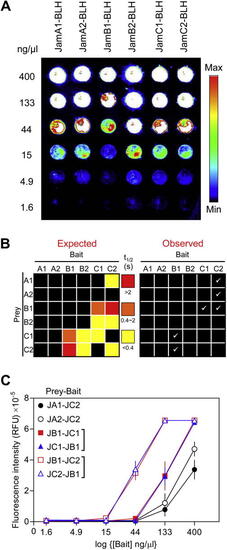
Quantitative benchmarking of the microarray AVEXIS using interactions within the zebrafish Jam family. (A) All six members of the zebrafish Jam family were expressed as biotinylated baits, purified, normalized, serially diluted, and arrayed on streptavidin-coated slides before detection with an anti-Cd4 primary antibody and a Cy3-conjugated goat anti-mouse secondary antibody. The image shows that similar levels of Jam bait proteins were immobilized on the slide. (B) Graphical representation of expected and observed interactions of different affinities within the zebrafish Jam family. The expected (left panel) interactions within the zebrafish Jam family were grouped according to their affinities (red = high affinity [ |