|
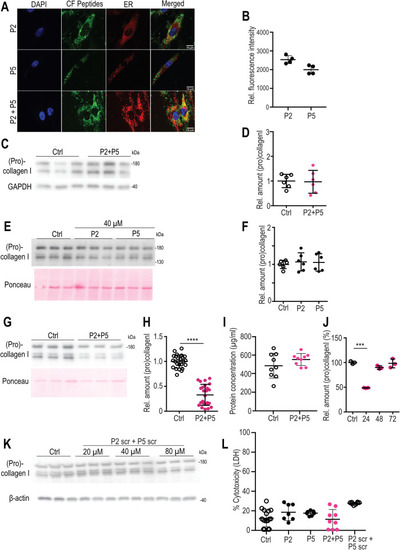
Uptake of fluorescently labeled peptides into primary human dermal fibroblasts and inhibition of procollagen I secretion. A Confocal micrographs of primary human dermal fibroblasts showing uptake of P2 + P5 supplied at 40 μM over 20 h in serum-free conditions. Co-staining with an ER marker in red. Bar: 10 μm. B Quantification of uptake of fluorescent peptides (N = 4, mean +/− SD of intracellular fluorescent intensity). C, D Representative western blot (C) and quantification of fibroblast lysates treated or not (Ctrl) with P2 + P5 at 40 μM for 20 h. N = 6 (D). E, F Representative western blot from supernatants; Ponceau staining reflects the loading control in the corresponding cell lysates (E). Quantification of supernatants of human fibroblasts treated for 20 h in serum-free conditions with either P2 or P5 at the indicated concentration. N = 6 (F). G, H Representative western blot from supernatants; Ponceau staining reflects the loading control in the corresponding cell lysates (G). Quantification of supernatants from untreated and P2 + P5 treated skin fibroblasts. N = 24; Mann– Whitney U test, two-tailed, **** p < 0.0001 (H). I Protein concentration of untreated and P2 + P5 treated cell lysates. N = 9. J Duration, in hours, of inhibitory effect after removal of P2 + P5. Levels of untreated (Ctrl) were set at 100%. N = 3 per time point, two-way ANOVA with Sidak’s multiple comparisons test. *** p < 0.0001. K Collagen I western blot of supernatants from controls and scrambled (scr) peptide-treated control fibroblasts and β actin western blot from corresponding cell lysates. L Determination of cytotoxicity of control fibroblasts treated with different peptides (measured by lactate dehydrogenase release (L, D, H)). N = 17 (Ctrl)/7 (P2)/7 (P5)/9 (P2 + P5)/8 (P2 scr + P5 scr). N = independent samples. Data shown as mean ± SD.
|