FIGURE

FIG. 1.

ID
ZDB-FIG-240425-41
Publication
Coltogirone et al., 2023 - Fish in a Dish: Using Zebrafish in Authentic Science Research Experiences for Under-represented High School Students from West Virginia
Other Figures
All Figure Page
Back to All Figure Page
FIG. 1.

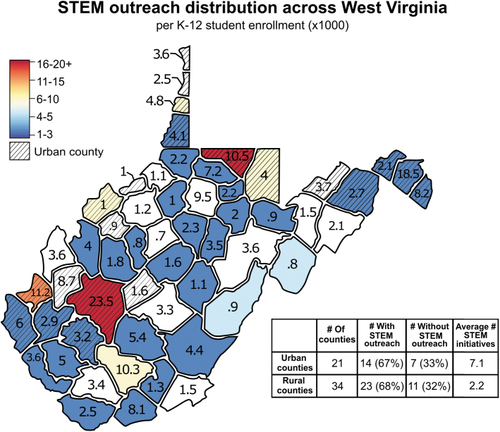
STEM outreach across West Virginia. Map displays the distribution of STEM outreach initiatives (summer camps, science centers, STEM programs, extracurricular clubs, and university-affiliated programs) across counties in West Virginia. The number of K-12 students per county for the 2020–2021 academic year is represented by the value within the county × 1,000 (data from the West Virginia Department of Education). Cooler colors indicate fewer outreach initiatives, warmer colors indicate more outreach initiatives, and no color indicates no outreach initiatives. Cross hatching indicates urban counties (data from the Economic Research Service, U.S. Department of Agriculture). Table summarizes the distribution of outreach across rural versus urban counties.

Expression Data

Expression Detail
Antibody Labeling
Phenotype Data

Phenotype Detail
Acknowledgments
This image is the copyrighted work of the attributed author or publisher, and ZFIN has permission only to display this image to its users. Additional permissions should be obtained from the applicable author or publisher of the image. Full text @ Zebrafish