
Fig. 4
- ID
- ZDB-FIG-240226-15
- Publication
- Baek et al., 2022 - Single-cell transcriptome analysis reveals three sequential phases of gene expression during zebrafish sensory hair cell regeneration
- Other Figures
- All Figure Page
- Back to All Figure Page
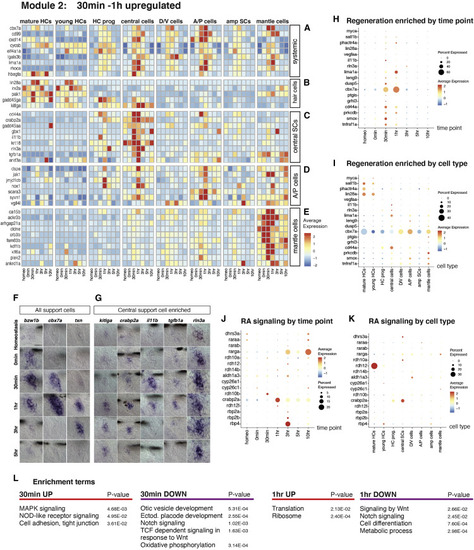
Upregulated genes 30 min to 1 h after HC death (A) Heatmap of the average expression of selected upregulated genes in several SC types and HC progenitors at 30 min to 1 h. (B–E) Heatmaps of the average expression of genes enriched in different cell types at 30 min to 1 h after HC death. (F and G) ISH images of genes upregulated at 30 min to 1 h in all (F) SCs and (G) central SCs. Scale bar, 20 μm. (H and I) Dot plots visualizing the average expression of (H) “regeneration enriched” genes across regeneration time points and (I) neuromast cell types. (J and K) Dot plots of the average expression of RA pathway genes across (J) regeneration time points and (K) cell types. (L) Gene enrichment term analysis of upregulated and downregulated genes at 30 min and 1 h after HC death compared with all other time points. |
Reprinted from Developmental Cell, 57(6), Baek, S., Tran, N.T.T., Diaz, D.C., Tsai, Y.Y., Acedo, J.N., Lush, M.E., Piotrowski, T., Single-cell transcriptome analysis reveals three sequential phases of gene expression during zebrafish sensory hair cell regeneration, 799-819.e6, Copyright (2022) with permission from Elsevier. Full text @ Dev. Cell