
- Title
-
Single-cell transcriptome analysis reveals three sequential phases of gene expression during zebrafish sensory hair cell regeneration
- Authors
- Baek, S., Tran, N.T.T., Diaz, D.C., Tsai, Y.Y., Acedo, J.N., Lush, M.E., Piotrowski, T.
- Source
- Full text @ Dev. Cell
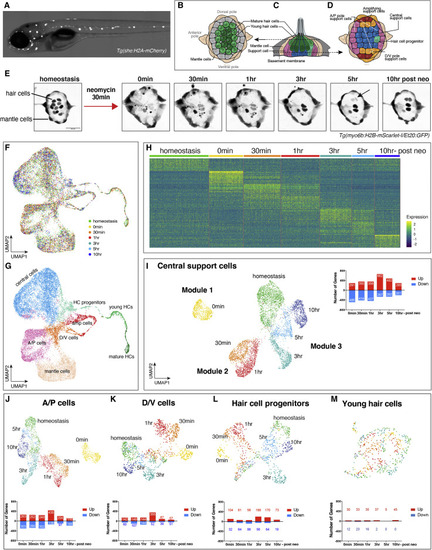
Spatiotemporal scRNA-seq analysis during lateral line HC regeneration (A) 5dpf Tg(she:H2A-mCherry) larvae were used for FACS of lateral line cells. (B–D) Illustration of homeostatic lateral line cell types. (B and D) Dorsal view and (C) lateral view. (E) Experimental timeline of scRNA-seq sample collection. Maximum intensity projection of confocal images of Tg(myo6b:H2B-mScarlet-I/Et20:GFP) neuromasts during HC regeneration. This transgenic line shows the HCs more clearly than the Tg(she:H2A-mCherry) line that was used for sorting. Scale bar, 20 μm; arrow indicates two new HCs. (F) Integration of scRNA-seq samples of seven different time points in UMAP latent space. (G) UMAP of a cluster analysis identifies eight different neuromast cell types. (H) Heatmap visualizing the top 25 genes in each time point during HC regeneration. (Differential gene expression analysis of each time point versus all other time points). (I–M) UMAPs of subsetted (I) central SCs, (J) A/P cells, (K) D/V cells, (L) HC progenitors, and (M) young HCs with bar graphs showing the number of upregulated and downregulated genes during regeneration (differential gene expression analysis of each time point versus homeostasis in individual cell type). |
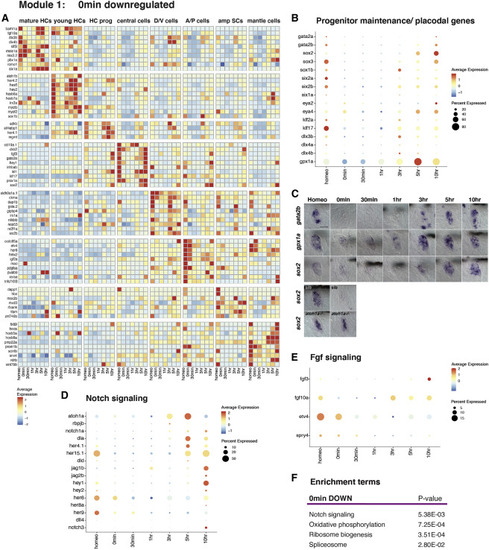
Downregulation of progenitor maintenance/ placodal genes, Notch, and Fgf signaling 0 min after HC death (A) Heatmap of selected cell-type-specific downregulated genes 0 min after neomycin treatment. (B) Dot plot of the average expression of progenitor/stem cell maintenance/placodal genes during HC regeneration. The size of the dots represents the proportion of cells expressing the gene. (C) ISH images of gata2b, gpx1a, and sox2 expression during HC regeneration. Bottom two rows: ISH of sox2 in siblings and atoh1a CRISPR mutants during homeostasis and 0 min after neomycin treatment. Scale bar, 20 μm. (D and E) Dot plots of the average expression of Notch (D) and Fgf (E) pathway members during HC regeneration. (F) Enrichment term analysis of downregulated genes 0 min after HC death compared with all other time points. |
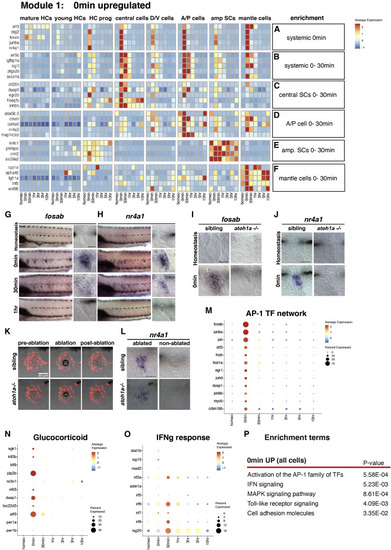
Injury/inflammatory response genes are rapidly upregulated 0 min after HC death (A and B) Heatmap of the expression of selected genes upregulated in all SCs at (A) 0 min and (B) 0–30 min. (C–F) Heatmaps of genes upregulated in different cell types at 0 min and 30 min after HC death. (G and H) ISH images of (G) fosab and (H) nr4a1 in neuromasts at homeostasis, 0 min, 30 min, and 1 h after HC death. Scale bar, 20 μm. (I and J) ISH images of (I) fosab and (J) nr4a1 expression in neuromasts of sibling and atoh1a CRISPR mutants at homeostasis and 0 min after HC death. Scale bar, 20 μm. (K) Confocal images of Tg(she:H2A-mCherry) neuromast cells and transmitted light during laser ablation in 5 dpf sibling and atoh1a CRISPR mutants. Scale bar, 20 μm. (L) ISH images of nr4a1 expression in laser-ablated and non-ablated neuromasts of sibling and atoh1a CRISPR mutants. Scale bar, 20 μm. (M–O) Dot plots of the relative expression of (M) AP-1 TF network members, (N) glucocorticoid receptor, and (O) IFN signaling in neuromasts during HC regeneration. (P) Gene enrichment term analysis for genes upregulated 0 min after HC death compared with all other time points. |
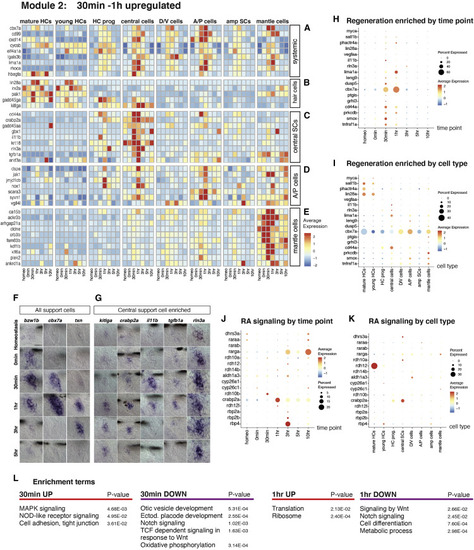
Upregulated genes 30 min to 1 h after HC death (A) Heatmap of the average expression of selected upregulated genes in several SC types and HC progenitors at 30 min to 1 h. (B–E) Heatmaps of the average expression of genes enriched in different cell types at 30 min to 1 h after HC death. (F and G) ISH images of genes upregulated at 30 min to 1 h in all (F) SCs and (G) central SCs. Scale bar, 20 μm. (H and I) Dot plots visualizing the average expression of (H) “regeneration enriched” genes across regeneration time points and (I) neuromast cell types. (J and K) Dot plots of the average expression of RA pathway genes across (J) regeneration time points and (K) cell types. (L) Gene enrichment term analysis of upregulated and downregulated genes at 30 min and 1 h after HC death compared with all other time points. |

Ribosome biogenesis, spliceosome, HC genes, Wnt, Notch, and cell-cycle genes are enriched 3–10 h after HC death (A) Heatmap of the average expression of selected genes upregulated in several cell types at 3–10 h after HC death. (B–E) Heatmaps of the average expression of selected cell-type-specific genes upregulated 3–10 h after HC death. (F) ISH images of nop58, dla, and mcm3 in neuromasts during HC regeneration. Scale bar, 20 μm. (G–K) Dot plots displaying the average expression per time point of (G) ribosome biogenesis, (H) spliceosome, (I) HC lineage, (J) Wnt signaling, and (K) cell-cycle genes. The dot size shows the percentage of cells that express the gene. (L) Cell-cycle genes by cell-type enrichment. Amplifying SCs are omitted. (M–O) Gene enrichment term analysis of upregulated and downregulated genes at (M) 3 h, (N) 5 h, and (O) 10 h after HC death compared with all other time points. |

Pseudotime analysis (injury response + progenitor activation) (A–C) UMAPs of pseudotime trajectories of subsetted central SC and HC lineage cells. (A) Dark purple shows cells at the beginning of pseudotime and yellow cells at the end. (B) UMAP with the location of cells from different time points highlighted in different colors. (C) Cluster analysis groups cells with similar transcriptomes into 10 different clusters. After the branch point, cells either follow the central SC lineage (blue arrow) or they follow the HC lineage (green arrow). (D) Feature plot of cd44a that is enriched in cells before the branch point. (E) gata2b is enriched in the central SC lineage. (F) rbm24a labels the HC lineage. (G) Heatmap of markers enriched in the injury response + progenitor activation population, partitioned into clusters. (H–J) Feature plots of fosab (H), irg1l (I), and lima1a (J) that are expressed in the injury response + progenitor activation central SC population. (K and L) Line plots showing the scaled expression of fosab, irg1l, and lima1a along the pseudotime trajectory in the (K) central SC lineage and (L) HC lineage. Individual cells are represented by color-coded tics on the x axis. |
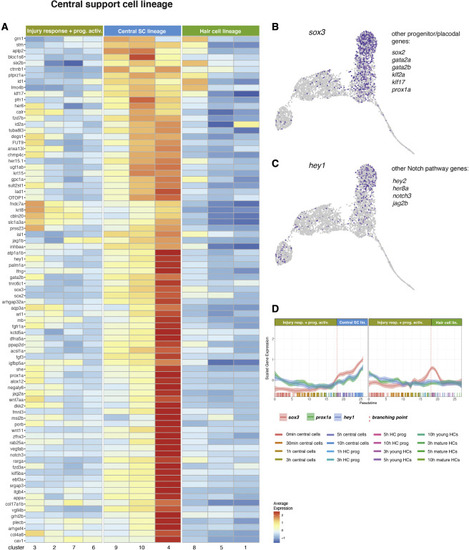
Pseudotime analysis (central SC lineage after the branch point) (A) Heatmap of the average expression of genes selectively enriched in the central SC lineage, partitioned by Louvain clusters. (B) Feature plot of sox3 and list of other expressed genes. (C) Feature plot of hey1 and list of Notch pathway members that are also expressed. (D) Line plots of the scaled expression of sox3, prox1a, and hey1 along the pseudotime trajectory in cells of the central SC lineage and HC lineage cells. Individual cells are represented by color-coded tics on the x axis. |
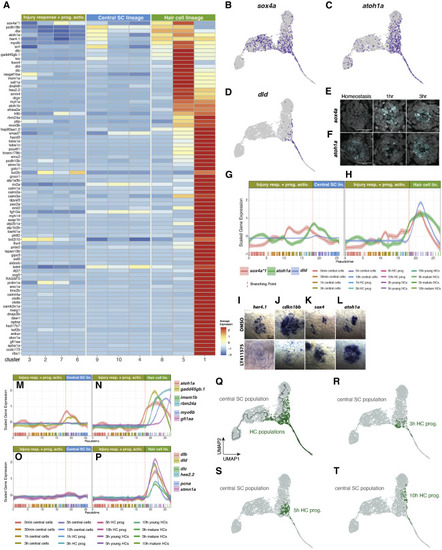
Pseudotime analysis (HC lineage after the branch point) (A) Heatmap of the average expression of genes selectively enriched in HC lineage cells, partitioned by Louvain clusters. (B–D) Feature plots of sox4a (B), atoh1a (C), and dld (D). (E and F) Fluorescent ISH (HCR) images of sox4a (E) and atoh1a (F) with DAPI in homeostasis, 1 h, and 3 h after HC death. Scale bar, 20 μm. (G and H) Line plots of sox4a, atoh1a, and dld scaled expression along the pseudotime trajectory in the (G) central SC lineage and (H) HC lineage. Individual cells are represented by color-coded tics on the x axis. (I–L) ISH images of her4.1, cdkn1bb, sox4a, and atoh1a in 5dpf DMSO- or LY411575-treated (to inhibit Notch signaling) neuromasts. Larvae were treated for 6 h before fixation. Scale bar, 10 μm. (M and N) Line plots of the scaled expression of atoh1a, insm1b, myo6b, gadd45gb.1, rbm24a, and gfi1aa along the pseudotime trajectory in the (M) central SC lineage and (N) HC lineage. Individual cells are represented by color-coded tics on the x axis. (O and P) Line plots of dlb, dld, dlc, hes2.2, pcna, and stmn1a scaled expression along the pseudotime trajectory in the (O) central SC lineage and (P) HC lineage. (Q) UMAP of the distribution of HC populations comprised HC progenitors, young HCs, and mature HCs. (R–T) UMAP of the distribution of 3 h, 5 h, and 10 h HC progenitor populations, respectively. |
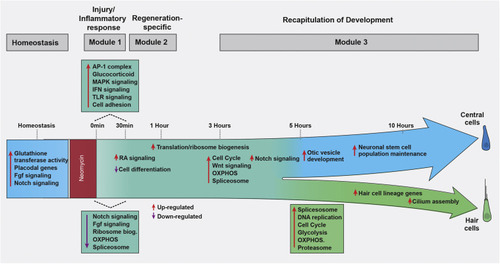
Overview of the molecular processes occurring during HC regeneration |
Reprinted from Developmental Cell, 57(6), Baek, S., Tran, N.T.T., Diaz, D.C., Tsai, Y.Y., Acedo, J.N., Lush, M.E., Piotrowski, T., Single-cell transcriptome analysis reveals three sequential phases of gene expression during zebrafish sensory hair cell regeneration, 799-819.e6, Copyright (2022) with permission from Elsevier. Full text @ Dev. Cell