FIGURE
Fig. 4
- ID
- ZDB-FIG-240130-15
- Publication
- Yang et al., 2023 - Optimized protocol for live imaging of overnutrition-elicited interactions between immune cells and β cells in zebrafish
- Other Figures
- All Figure Page
- Back to All Figure Page
Fig. 4
|
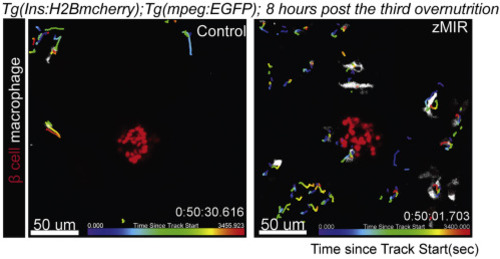
Track macrophages near the principal islet in control and zMIR fish from 64 to 65 h post treatment using Imaris The islet is labelled by H2B-mCherry (red) and macrophages are labelled by EGFP (white). Each track is color coded to indicate the time during which the macrophage was tracked. The color gradient at the bottom of each image represent the tracking time. |
Expression Data
Expression Detail
Antibody Labeling
Phenotype Data
Phenotype Detail
Acknowledgments
This image is the copyrighted work of the attributed author or publisher, and
ZFIN has permission only to display this image to its users.
Additional permissions should be obtained from the applicable author or publisher of the image.
Full text @ STAR Protoc

