
FIGURE
Figure 6.
- ID
- ZDB-FIG-230719-16
- Publication
- Dryer et al., 2023 - Comparison of tumor growth assessment using GFP fluorescence and DiI labeling in a zebrafish xenograft model
- Other Figures
- All Figure Page
- Back to All Figure Page
Figure 6.
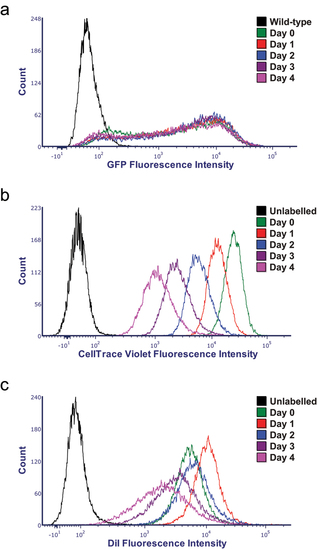
Flow cytometry analysis of GFP-expressing DiI labeled MDA-MB-231 cells. (a–c) Histograms of GFP, CellTrace Violet and DiI fluorescence intensity distribution for the GFP-expressing DiI and CellTrace Violet labeled cells at 0 to 4 days in culture, indicated by green, red, blue, dark and light purple traces, correspondingly. The black trace in (A) corresponds to the histogram for MDA-MB-231 cells that do not express GFP that were used as a control (labeled as wild-type in the figure). The black trace in (B) and (C) corresponds to histograms for DiI-unlabeled GFP-expressing MDA-MB-231 cells used as a control. |
Expression Data
Expression Detail
Antibody Labeling
Phenotype Data
Phenotype Detail
Acknowledgments
This image is the copyrighted work of the attributed author or publisher, and
ZFIN has permission only to display this image to its users.
Additional permissions should be obtained from the applicable author or publisher of the image.
Full text @ Cancer Biol. Ther.