
- Title
-
Comparison of tumor growth assessment using GFP fluorescence and DiI labeling in a zebrafish xenograft model
- Authors
- Dryer, Y., Berghausen, J., Creswell, K., Glasgow, E., Brelidze, T.I.
- Source
- Full text @ Cancer Biol. Ther.

Schematic of zebrafish xenograft assay. Representative brightfield and fluorescent images of zebrafish injected with GFP-expressing DiI labeled MDA-MB-231 cells and their overlay on Day 0 and Day 3 after the injection. The cells were injected into the yolk sac of 2 dpf zebrafish, as illustrated on the brightfield image for Day 0. Scale bar = 500 μm. |
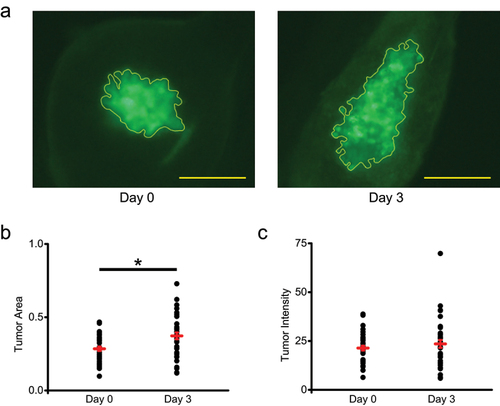
GFP fluorescence of zebrafish xenografts of GFP-expressing and DiI labeled MDA-MB-231 cells. (a) Representative image of a zebrafish xenograft tumor area outlined in yellow based on the GFP fluorescence on Day 0 and Day 3 post-injection into 2pdf zebrafish embryos. Scale bar = 50 μm. (b) Quantification of tumor area based on the GFP fluorescence on Day 0 and Day 3. Average tumor area was 0.28 ± 0.01 on Day 0 and 0.37 ± 0.02 on Day 3 ( |

DiI labeling of zebrafish xenografts of GFP-expressing and DiI labeled MDA-MB-231 cells. (a) Representative image of a zebrafish xenograft tumor area outlined in yellow based on the DiI labeling on Day 0 and Day 3 post-injection into 2pdf zebrafish embryos. Scale bar = 50 μm. (b) Quantification of tumor area based on the DiI labeling on Day 0 and Day 3. Average tumor area was 0.28 ± 0.01 on Day 0 and 0.42 + 0.03 on Day 3 ( |
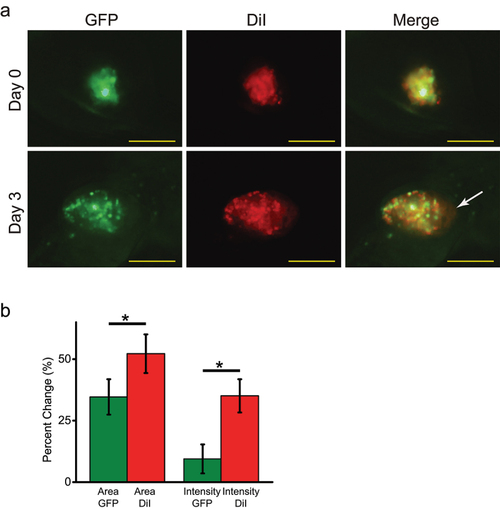
Comparison of GFP fluorescence and DiI labeling of zebrafish xenografts of GFP-expressing and DiI labeled MDA-MB-231 cells. (a) Representative DiI, GFP and merged fluorescence images of a zebrafish xenograft tumor on Day 0 and Day 3 post-injection into 2pdf zebrafish embryos, as indicated. The white arrow indicates the DiI labeled border area of the tumor that lacks GFP-fluorescence. Scale bar = 50 μm. (b) Percent change in the tumor area and intensity determined based on the GFP fluorescence or DiI labeling. Average percent change in tumor area was 34.62 ± 7.2 based on the GFP fluorescence and 52.22 ± 7.86 based on the DiI labeling ( |

Imaging of GFP fluorescence and DiI labeling of MDA-MB-231 cell cultures. Representative brightfield and GFP, DiI and merged fluorescence images of the MDA-MB-231 cells on Day 0 and Day 3 of the experiment. |
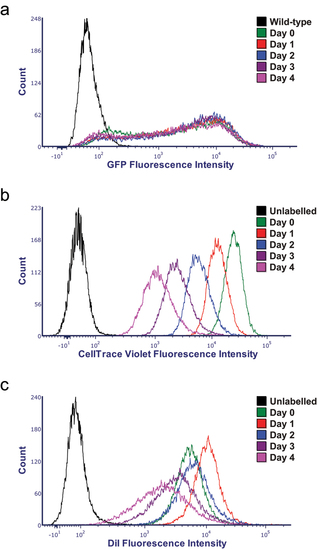
Flow cytometry analysis of GFP-expressing DiI labeled MDA-MB-231 cells. (a–c) Histograms of GFP, CellTrace Violet and DiI fluorescence intensity distribution for the GFP-expressing DiI and CellTrace Violet labeled cells at 0 to 4 days in culture, indicated by green, red, blue, dark and light purple traces, correspondingly. The black trace in (A) corresponds to the histogram for MDA-MB-231 cells that do not express GFP that were used as a control (labeled as wild-type in the figure). The black trace in (B) and (C) corresponds to histograms for DiI-unlabeled GFP-expressing MDA-MB-231 cells used as a control. |